By Outrank
SaaS Customer Retention: Metrics and Playbooks
SaaS customer retention with GRR and NRR benchmarks, cohort windows, churn-signal priority, and playbooks you can run this quarter.
On this page
Most founders check churn after customers have already decided to leave. That's too late, and it's also the wrong place to look first. Strong SaaS customer retention starts earlier, with clear definitions, revenue based metrics, and a short queue of billing and renewal signals that deserve a human response before the renewal date arrives.
Why a Small Retention Gain Changes SaaS Profit
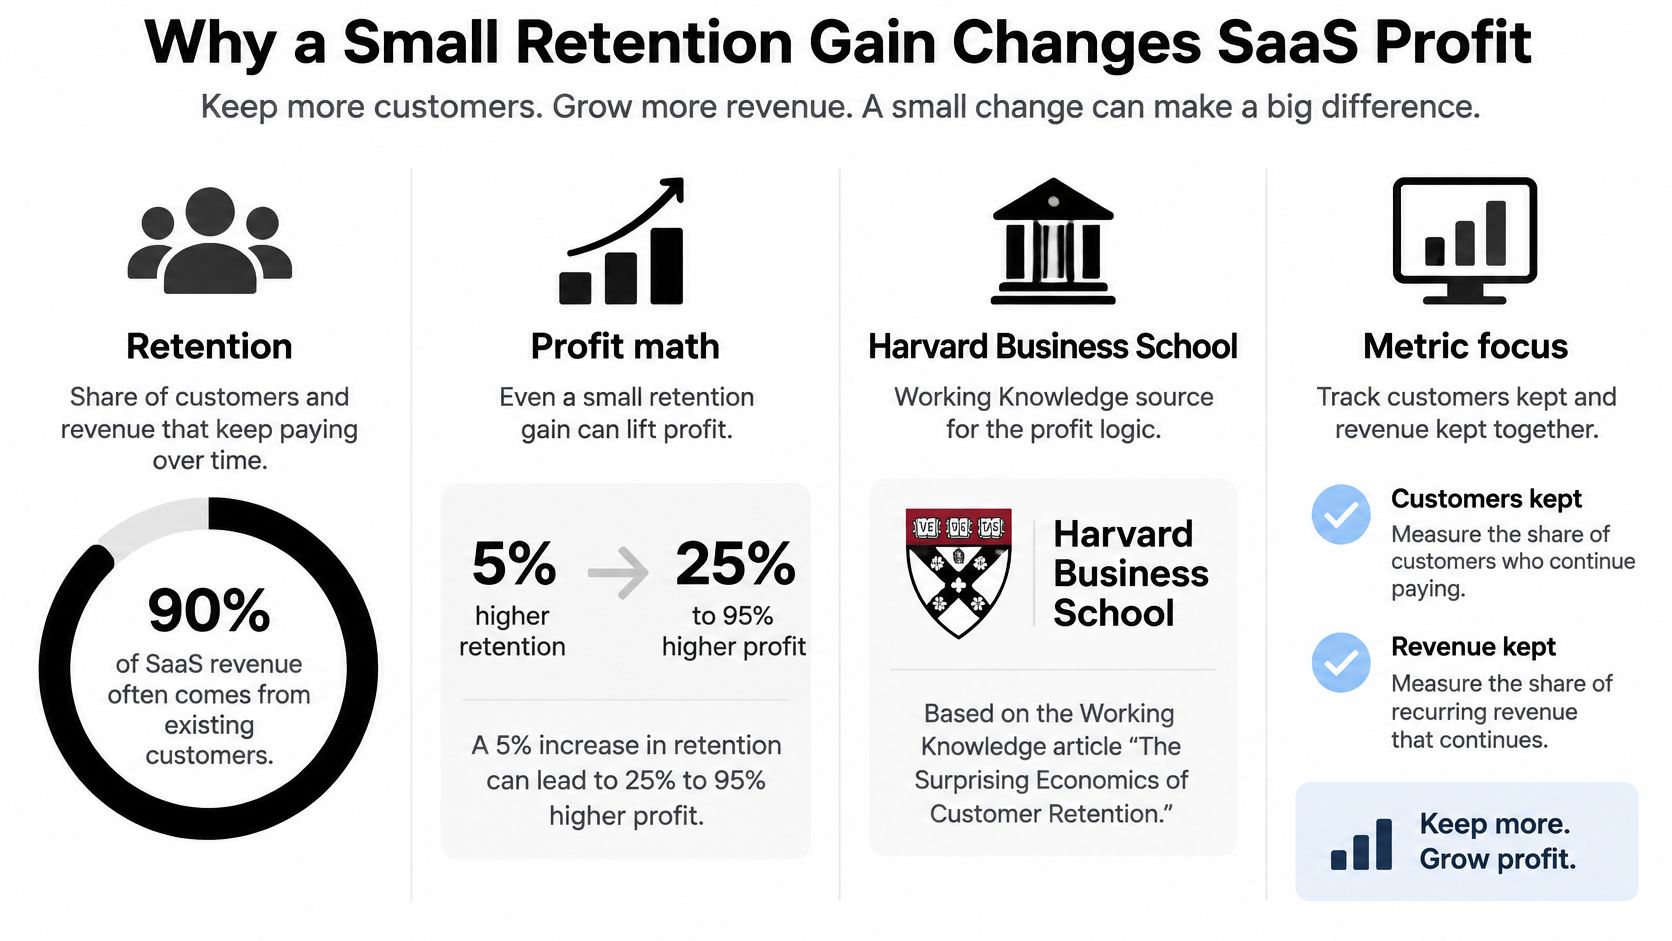
SaaS customer retention is the share of customers, and of the revenue they represent, that keep paying over a set period. The Harvard Business School Working Knowledge summary of Bain and Company and Harvard Business School analysis found that increasing retention by 5 percentage points can increase profits by 25% to 95%, depending on the industry and operating model. That range sounds large because retention changes several costs and revenue lines at once.
SaaS makes the effect sharper. You usually pay for ads, sales time, onboarding, and support before a subscription has repaid its acquisition cost. Every extra month after payback adds revenue without requiring you to buy that customer again.
Why value often arrives late
A loyal customer generally costs less to serve once setup is done. They know the workflow, file fewer basic tickets, and are more likely to add seats or use more of what they've bought. The same analysis noted a parallel outside SaaS, where repeat apparel e-commerce customers spent more than twice as much during months 24 to 30 as they did during the first six months. The lesson transfers because customer value often rises after the expensive early period, not during it.
Say a small B2B tool spends heavily to win a team, then needs several paid months to recover that spend. If the team cancels just before payback, growth looks busy while profit stays thin. If the team stays, expands, and needs less hand holding, the same account becomes the cheapest revenue you can grow.
What to judge beside the percentage
Don't judge retention as one share of accounts still active. Read it beside expansion revenue, support cost, and acquisition payback, because two retained logos can have very different economics. One account may stay and grow. Another may stay, downgrade, and consume constant support.
A retained customer is not automatically a profitable customer. Retention pays when kept revenue grows faster than the cost of keeping it.
Investors watch this tension closely. In the 2024 SaaSiest Benchmark Report cited by Simon-Kucher, 51% of investor respondents expected achieving sustainable growth and retention to be the biggest challenge for B2B SaaS companies in 2024. That's a useful warning against treating new logos as proof of health while the base leaks.
Your practical takeaway is simple. Before you buy more acquisition, find out whether current customers stay long enough to repay what they cost. If you want the value side in more depth, our guide to SaaS lifetime value explains how retained revenue becomes long term account worth.
The Retention Metrics That Replace One Churn Rate
One churn rate hides too much. It counts logos, but it doesn't tell you whether the customers who stayed kept paying the same amount, paid less, or paid more. You need a small scoreboard that separates accounts from dollars.
The five definitions in plain language
Customer churn is the accounts lost during a period divided by the accounts you had at the start. If you start with 100 accounts and lose 8, churn is 8% for that period. Logo retention is what's left, 92% in that example.
Gross revenue retention, or GRR, asks how much starting revenue you kept after cancellations, downgrades, and contraction. It ignores expansion on purpose, so it shows leakage without makeup. Net revenue retention, or NRR, adds expansion from that same starting base back in, which shows whether growth inside accounts offsets what you lost.
A summary of SaaS Capital's 2025 benchmark survey of more than 1,000 private B2B SaaS companies reports median GRR of 91% and median NRR of 101%. Read those as directional bars for private B2B SaaS, not as a grade for every self serve product. Monthly plans with low contract values behave differently because customers can leave quickly and often.
Lifetime value is the revenue or gross profit you expect over the whole relationship. The quick formula is average revenue per account times gross margin, divided by churn. A cohort sum, where you add actual kept revenue month by month, is more honest when churn is uneven across customer types.
The lookup table for board updates
SaaS retention metrics and 2025-2026 benchmarks
| Metric | Includes | Calculation | Ceiling | Benchmark |
|---|---|---|---|---|
| Logo retention | Accounts still customers | Ending logos / starting logos | 100% | At least 90% annual for enterprise best-in-class |
| Customer churn | Accounts lost | Lost logos / starting logos | No cap | No more than 10% annual if logo retention is 90% |
| Gross revenue retention | Revenue kept after cancel and downgrade | (Starting revenue minus churn and contraction) / starting revenue | 100% | Median 91% among private B2B SaaS |
| Net revenue retention | GRR plus expansion | (Starting revenue minus churn and contraction plus expansion) / starting revenue | Can exceed 100% | Median 101% among private B2B SaaS |
| Lifetime value | Expected revenue or gross profit | ARPA times gross margin / churn, or a cohort sum | No cap | No universal benchmark; compare with CAC payback |
The enterprise logo bar needs care. The 2025 academic review on SaaS customer retention describes retaining at least 90% of clients from one year to the next as best-in-class for software companies targeting enterprise customers. It also states that retaining existing customers costs approximately 20% as much as acquiring a new customer, which is why these metrics belong in finance discussions, not only in customer success reports.
The confusion to avoid
NRR above 100% does not mean almost everyone stayed. A company can lose many small accounts, expand a few large ones, and still post strong NRR. That's why 110% NRR does not imply that 90% of customers remain.
Practical rule: Report logo retention, GRR, and NRR side by side every period. If NRR rises while GRR falls, expansion is masking a leak.
Use GRR to find the leak. Use NRR to see whether expansion covers it. Use logo retention to see how many relationships you kept. Together, they replace the single churn rate that used to start the conversation.
Cohort Windows That Show Who Actually Stays
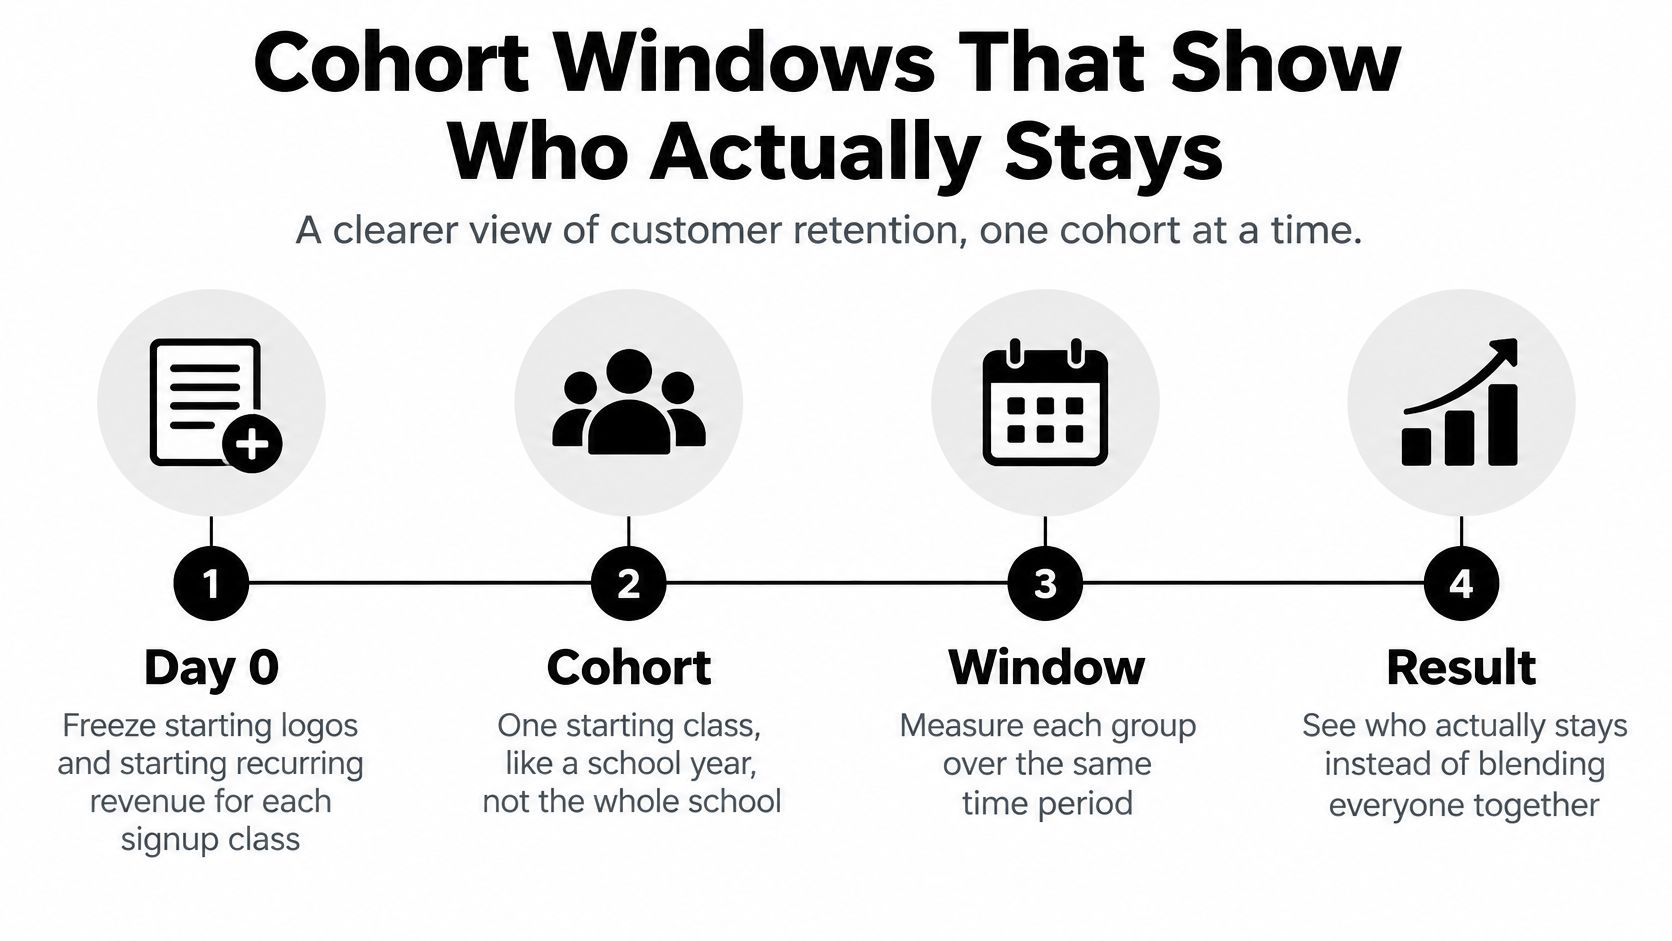
A cohort is one starting class, like a school year, not the whole school. January signups form one cohort, February signups form another, and you follow each group forward on the same clock. That discipline stops a strong new month from hiding an older group that's gradually leaking.
Four steps to build the view
- Freeze day 0. For each signup week or month, record starting logos and starting recurring revenue. Never let later signups enter that group.
- Tag who they are. Add initial plan, company size, acquisition channel, and first value date to every account.
- Measure fixed windows. At 30, 90, 180, and 365 days, record retained logos, contracted revenue, and expanded revenue against the frozen start.
- Read down each column. Compare cohorts at the same age, so a mature group at day 180 is judged against other groups when they were at day 180.
If this is new to your team, our primer on what cohort analysis is explains how to read the grid before you build your own. The key habit is comparing like with like. A blended retention rate mixes brand new users, who haven't had time to leave, with older users who have.
Why segments expose the real problem
Segment level GRR matters because company level NRR can look fine while one group fails. Large accounts might expand enough to cover small accounts leaving in numbers. When you split GRR by plan, size, or channel, that failure shows up early, while you can still fix pricing, onboarding, or your acquisition source.
Say paid search brings many trials that never reach value, while referrals bring fewer trials that stay. A blended view makes onboarding look average. A channel cohort view shows an acquisition quality problem that more in app tips won't solve.
Define activation before you measure it
Pick one activation event tied to durable value. Good candidates include completing the core workflow, inviting a teammate, integrating a core data source, or producing a repeated output. Then measure activation rate and time to value by signup cohort.
A study summary of B2B SaaS onboarding research reports that the treated group experienced fewer first-week churn events and support questions, alongside higher accumulated usage over eight months. The description doesn't establish randomized identification, so read it as an association, not proof that the onboarding change caused the outcome.
Don't credit new onboarding copy for retention until a holdout group shows later renewal or expansion, not only more clicks.
Read early churn, support burden, usage depth, and 90-day retention together. If a cohort generates many setup tickets and little core usage, you likely have friction. If it generates few tickets and no return visits, you may have attracted the wrong users in the first place.
Churn Signals Worth a Human Before Renewal
Founders often start with feature adoption because product analytics makes usage easy to see. That habit can mislead you. Some of the strongest warnings sit in billing and renewal settings, where a customer has already taken a concrete step toward leaving.
Separate no value from quiet exit
A recent analysis of 44,000 users reports that customers who never perform a product's core action churn at 3 to 6 times the rate of those who do. The same analysis identifies non-renewal signals as among the strongest available predictors, with average churn after such a signal reaching 40% and exceeding 90% in some cases.
Those are two different problems. The first customer never got value, so they need onboarding help or a better fit check. The second customer may still log in every week while procurement plans a change, seats shrink, or auto-renew sits switched off. An active user can still be leaving.
Rank the queue by time and revenue
If you don't have a customer success department, you can't call everyone. Rank each signal by how much time is left and how much revenue is at risk. Failed payments come first because the loss is often involuntary and the window is measured in days, not quarters.
Churn signals a small SaaS team should staff first
| Signal | Type | Act within | Why it ranks here |
|---|---|---|---|
| Failed payment | Billing | Within days | Involuntary churn that a dunning fix can still recover |
| Auto-renew disabled or renewal date near | Billing | Before the renewal date | Average churn after a non-renewal signal about 40%, above 90% in some cases |
| Seat reduction or downgrade | Revenue | Same billing cycle | Contraction lowers GRR even if the account stays |
| Never performs the core action | Usage | First 7 to 14 days | Churn is 3 to 6 times the rate of customers who do the action |
| No return after the activation window | Usage | By day 30 | Early cohort leak that later NRR will hide |
Seat reductions deserve more attention than they usually get. The account still counts as retained, so logo retention looks stable. GRR falls in the current cycle, and the smaller footprint often means fewer internal champions at renewal.
Give every signal an owner and a clock
A signal without an owner is only a chart. Assign each row to a person, set the response window, and define what counts as saved.
- Billing owner: Contact the payer, fix the card or invoice issue, and confirm the next charge date.
- Founder or success owner: Ask why renewal is off, then offer the smallest change that solves the stated problem.
- Product owner: Review accounts missing the core action for a shared setup blocker.
Score the work by recovered revenue, not by how many logos someone marked as contacted.
This queue challenges a common assumption. More in app engagement isn't always the best leading indicator, and a generic usage nudge isn't always the best save. Start where intent is explicit, then work toward the vaguer signs of disengagement.
Playbooks for Onboarding Pricing and Exit Paths
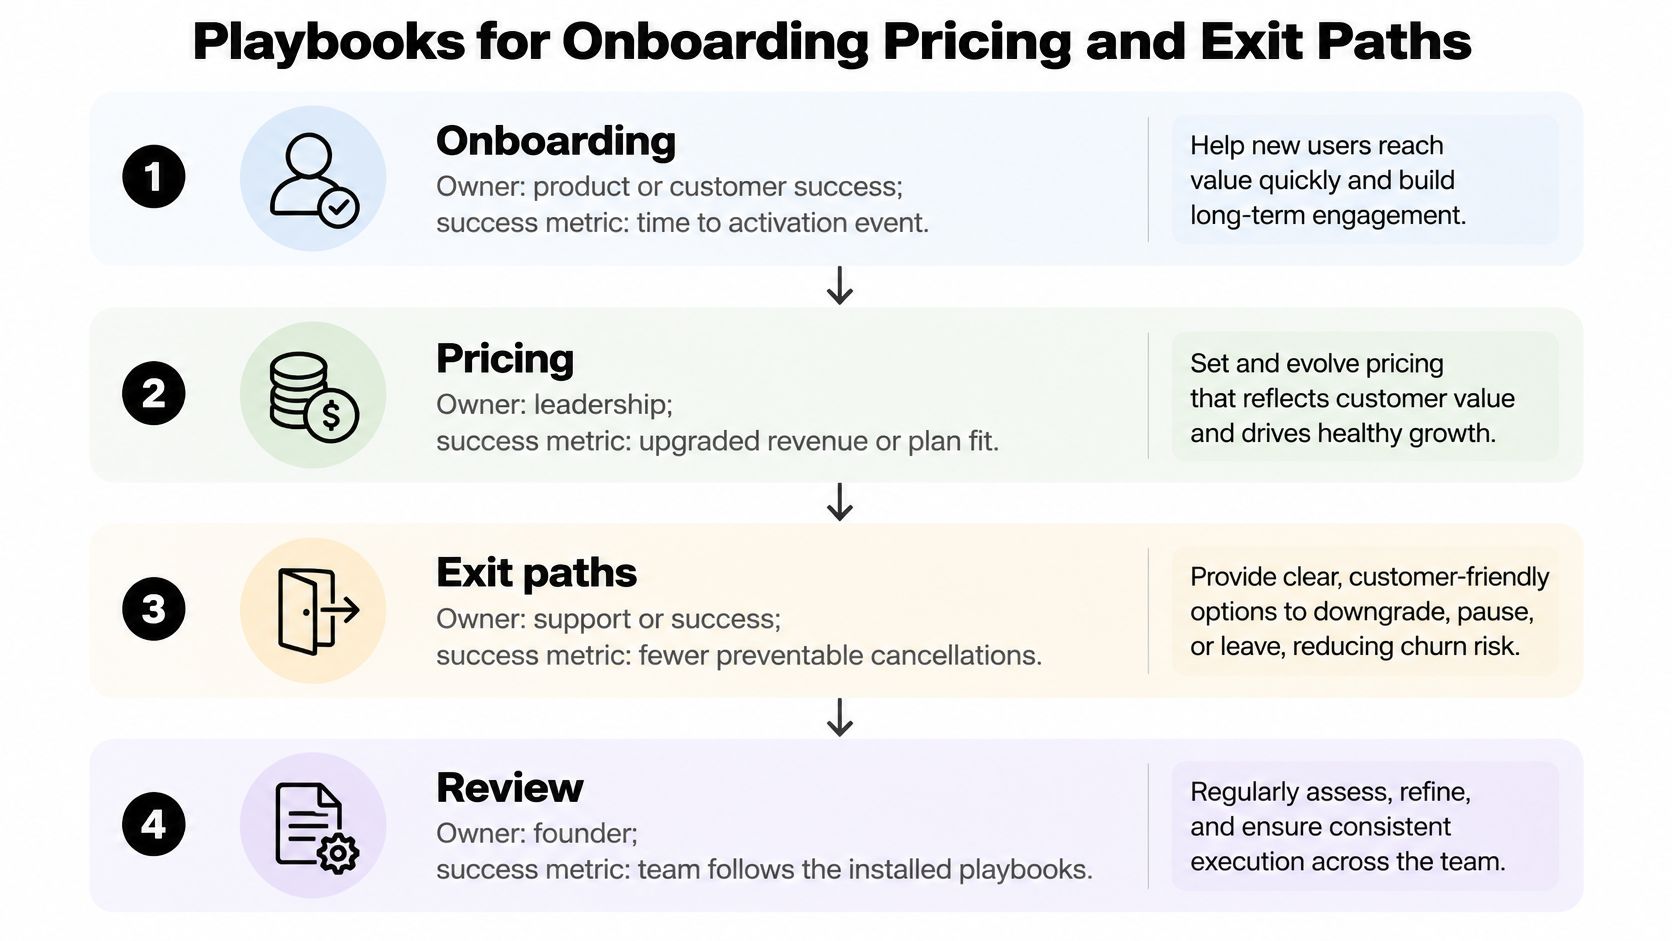
Once a signal fires, you need a response that a small team can repeat. Install these playbooks in order, each with one owner and one success metric, rather than launching every idea at once.
Four responses to install first
Onboarding owns time to the activation event. Offer a short guided setup and a template for the first real workflow, then add a human call only when account value clears a line you state in advance. Our guidance on onboarding process improvement can help you decide what to automate and what to keep personal.
Engagement owns the missing core action, not newsletter opens. Message only accounts that haven't done the event, and make the message help them finish that one job. A customer who has completed the workflow doesn't need another tour.
Pricing owns contraction. Annual customers need a procurement friendly amendment when budgets or headcount change, while usage and seat based plans need a downgrade path that doesn't force a save call. The success metric is plan fit that keeps revenue, not pressure that delays a cancel by one cycle.
Support owns repeated themes inside a weak cohort. When the same setup question appears across accounts of the same age, feed it to product as a fix. A generic check in call won't repair a broken import step.
Treat an easy exit as a retention design
Hard cancellation paths can protect this month's revenue while damaging trust. In a US and UK survey of 1,454 consumers, 82% said easy cancellation makes them more likely to subscribe, 78% wanted pause-or-swap options, and 58% had paused a subscription instead of canceling when that option existed. Those respondents were consumers, so test the logic in your B2B context instead of importing the percentages as a forecast.
There is subscription evidence closer to the operating decision. Recurly's 2025 State of Subscriptions research found that pausing features retained 51.7% of at-risk customers and had grown 66% year over year. For a founder, the useful point is practical. A pause can preserve the relationship when the problem is timing, budget, or a temporary project gap.
Customer autonomy is not automatically a concession. Control, transparency, and a reversible choice can keep a door open that a forced cancel slams shut.
Match the exit path to the customer type. Self serve tools can test pause, temporary suspension, and seat reduction beside cancel. Enterprise products should favor predictable renewal terms and clean amendments over mandatory calls that procurement teams remember at the next negotiation.
Measure what happens after the offer. Track return from pause, revenue kept after downgrade, and NRR in later periods. A same day save that becomes a resentful cancel next month is not a win, and a pause that returns at full value is not a loss.
Experiments Emails and a Short NPS Survey
You don't need a research team to learn what works. You need three small experiments, each with a hypothesis, a holdout, and a downstream metric that matters after the click.
Here's the setup a founder can run in a spreadsheet and an email tool.

Three experiments with real finish lines
Experiment A compares a guided first workflow checklist with your current empty state. Randomly hold out part of each new cohort, then judge day 30 logo retention. Checklist completion is only a clue, because users can click through steps without getting value.
Experiment B sends a three email dunning sequence over seven days for failed cards. Keep the copy plain, vary the subject or send time if you must, and judge recovered recurring revenue. Before you send, test email deliverability so a billing recovery message doesn't fail for a technical reason that has nothing to do with customer intent.
Experiment C places pause or downgrade beside a discount on the cancel path. Judge 90-day return and NRR, not the same day save rate. A discount may win today and train price sensitivity, while a pause may return the account at full value later.
Small cohorts need patience. Let the window run longer instead of declaring a winner from a handful of accounts. Keep the holdout even when early clicks look exciting, because clicks are not renewal.
Email skeletons you can adapt
The short walkthrough below shows how to keep lifecycle messages tied to one event and one next step.
- Welcome: Name the single value event, give a realistic deadline, and link to the template that gets them there.
- Day 7 missing event: Send only if the event hasn't happened. Ask what blocked them and offer one concrete fix.
- Failed payment: State the amount, the date limits begin, and one link to update the card.
- Pause confirmation: State the resume date, what data stays available, and how to restart early.
A short NPS survey that routes to action
Ask the 0 to 10 recommendation question after the value event, never at signup. Add one open question asking what almost stopped them from getting value. Score 9 to 10 as promoters, 7 to 8 as passives, and 0 to 6 as detractors.
Route detractors into the human queue within two business days. A low score tied to a named blocker is work for a person, not material for a monthly sentiment chart.
What a Retention Dashboard Should Show
Build the first version in a spreadsheet. A founder who understands five numbers every week will make better decisions than a team that buys software and stares at forty charts nobody owns.
The three views that earn screen space
The top row shows logo retention, GRR, NRR, and active customer count, each beside the prior period. Put the prior period next to the current one every time. A number without a comparison invites storytelling.
The second view is a cohort heatmap from month 0 through month 12. Rows are signup cohorts, columns are age, and each cell shows revenue retained against the frozen start. You'll spot a bad month, a weak channel, or a renewal cliff that a blended average smooths away.
The third view splits involuntary churn from failed payments away from voluntary cancellation. Mixing them hides a billing problem inside a product story. A card failure needs dunning and payment retries, while a voluntary cancel needs a value, pricing, or fit conversation.
Filters and cadence
Every view needs the same filters so you can compare cuts without rebuilding the sheet.
- Plan: Shows whether entry pricing retains worse than mid tier plans.
- Acquisition channel: Shows whether a cheap channel produces expensive churn.
- Company size: Shows whether small accounts fail for different reasons than larger teams.
- First value date: Shows whether slow time to value predicts weak later retention.
Set the rhythm in one place. Review failed payments and new cohort activation weekly. Review GRR and NRR monthly, because revenue retention needs a full billing cycle to mean much. Review pricing, pause, and downgrade results quarterly, when you can see whether saves returned and expanded.
If a metric has no review date and no owner, remove it from the dashboard until it drives a decision.
Tools as roles, not brands
Your billing system is the source for renewals, seat changes, downgrades, and dunning outcomes. Product analytics owns the core action event and time to value. The support desk explains a cohort dip through ticket themes. A sheet or CRM holds the human queue and records whether revenue was recovered.
Beware any view that shows only logo churn. It will miss contraction, flatter accounts that shrank, and make healthy looking NRR seem safer than the base really is. Start with the four numbers in the top row, the cohort view, the billing split, and the three cadences. Add another chart only when a recurring decision requires it.
Start With One Cohort and One Save Motion
This week, make one narrow decision. Freeze one signup cohort, report GRR and NRR beside logo retention, and staff only two signals, failed payment and disabled renewal. Don't install every playbook at once, because you'll finish none of them and learn nothing cleanly.
If your cohort is still tiny
A newly shipped product may not have enough customers for a stable cohort read. The fix is a clean set of new users you can measure, not another feature nudge sent to everyone you know. A launch wave, beta invite list, or signup push can become that cohort if every user shares one activation event, one day 30 check, and the same billing queue later users will get.
SubmitMySaas lets makers submit their product launch for visibility, feedback, and a high-authority backlink. A Premium Launch costs $19 per launch and gives priority placement in an available Monday launch, and it includes a guaranteed high authority dofollow backlink. Treat any users who arrive that way as a tagged cohort, not as proof of SaaS customer retention on launch day.
Don't read launch traffic, upvotes, or signups as retention. Retention begins when those users reach value, stay past the early window, and keep paying after the first billing decisions arrive.
The month end test
Once the billing queue works, run one more test. Put pause against a discount on the cancel path and bring the result into your quarterly NRR review. Keep the offer narrow enough that you can tell what changed.
By month end, your scoreboard should show three things.
- One frozen cohort: Logo retention, GRR, and NRR read together.
- Two staffed signals: Failed payment and disabled renewal, each with an owner and response window.
- One named save motion: Recovered revenue you can state in dollars, not effort you can describe in meetings.
That is a working retention system at founder scale. It starts with billing intent, respects a customer's need to pause or shrink, and uses usage where it explains the risk.
If you're launching or relaunching a SaaS product, a clean measurable cohort is the fastest way to learn whether new users reach value and stay. SubmitMySaas helps makers submit launches for visibility and feedback, so visit today, tag the users who arrive as one cohort, and judge the launch by day 30 activation and retained revenue rather than signups alone.