SaaS Lifetime Value: A Founder’s Complete Guide
Learn how to calculate SaaS lifetime value accurately using cohort and margin-adjusted methods, benchmarks, and proven tactics to improve unit economics.

SaaS lifetime value is the gross-margin revenue a customer generates over their active lifespan, and healthy companies target an LTV:CAC ratio between 3.2x and 4.1x. Median SMB LTV is around $9,850, compared with around $43,200 for mid-market SaaS.
You may already have an LTV number in a board deck, a spreadsheet, or a dashboard. The problem is that the number may combine self-serve customers with sales-led accounts, ignore expansion revenue, or assume that churn stays constant forever. It looks precise, but it may not describe any real customer group.
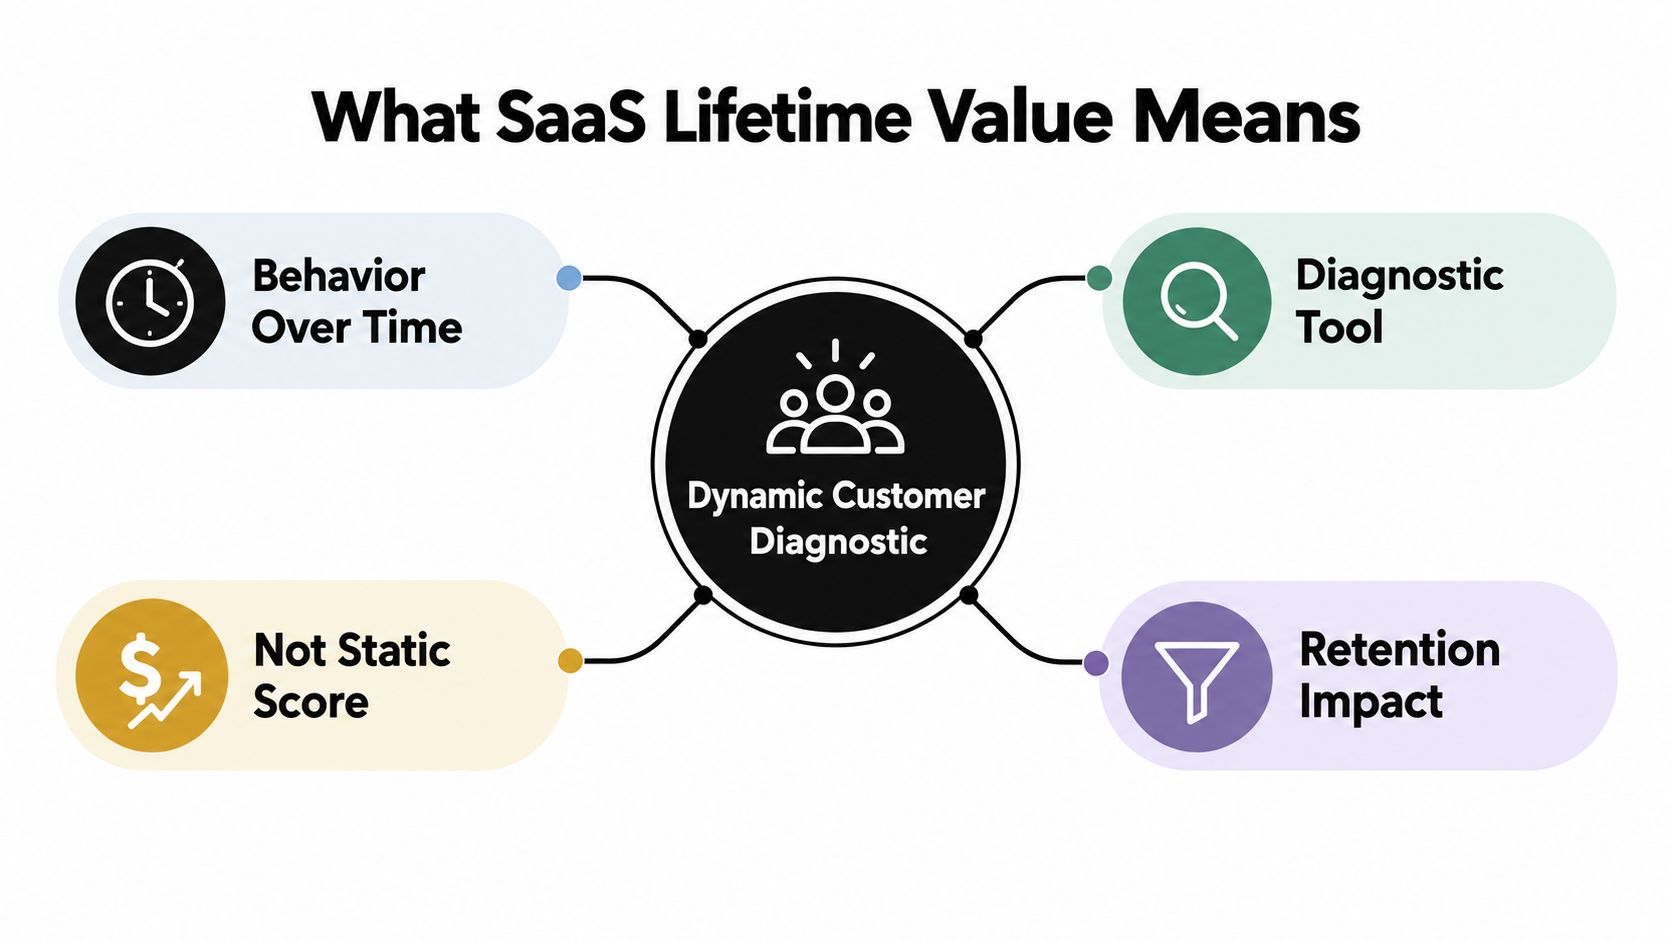
That's why experienced SaaS operators don't ask only, “What's our LTV?” They ask, which customers generate that value, through what retention motion, at what acquisition cost, and with how much gross margin? SaaS lifetime value is less a scoreboard figure than a diagnostic for deciding where to invest.
What SaaS Lifetime Value Actually Means
SaaS lifetime value measures the gross profit a customer account is expected to generate during its subscription relationship. Revenue alone isn't enough. A customer who pays well but requires heavy infrastructure, support, or account management may produce less economic value than the revenue figure suggests.
A useful starting definition is:
LTV = revenue per account × expected customer lifespan × gross margin
The formula is only a starting point because each input reflects customer behavior. Revenue per account changes through upgrades, downgrades, and usage. Lifespan changes when onboarding, product adoption, or support improves. Gross margin changes when service costs rise as accounts become more complex.
Why the standalone number misleads
A raw LTV figure doesn't tell you whether growth is efficient. You need to compare it with customer acquisition cost, or CAC, which includes the sales and marketing investment required to win the account. The relationship between the two determines whether your acquisition engine can scale without destroying cash.
The benchmark used by many SaaS operators is an LTV:CAC ratio above 3:1. Recent benchmark framing places the median between 3.2x and 4.1x, while also emphasizing that there's no universal dollar-average LTV for SaaS businesses. The same source gives indicative lifetime-value ranges of roughly $15,000 to $40,000 for SMB SaaS, $80,000 to $200,000 for mid-market, and $300,000 to $1,000,000 or more for enterprise, with customer lives ranging from 2 to 3 years up to 5 to 7 or more years. These figures are reported in SaaS lifetime value benchmark guidance.
Practical rule: A high LTV with slow payback can create more cash pressure than a lower LTV with efficient acquisition.
Treat LTV as a customer diagnostic
Segment the metric before you use it. At minimum, separate customers by company size, acquisition channel, pricing plan, contract type, and product usage. A blended figure can hide a profitable mid-market motion behind an unprofitable self-serve motion, or make a healthy enterprise segment look weak because smaller accounts churn earlier.
A strong segmentation strategy for SaaS turns LTV into an operating tool. It helps marketing decide which channels deserve more budget, helps sales qualify accounts, and helps customer success identify where intervention is likely to protect future gross profit.
How to Calculate SaaS Lifetime Value
The right calculation method depends on your data maturity. A simple model is useful when your pricing and customer behavior are still changing. A cohort model becomes more useful as retention history accumulates. A mature business may need margin-adjusted revenue curves that capture expansion and account-level service costs.
Start with the simple estimate
For an early-stage SaaS company, begin with average revenue per account and churn:
LTV = average monthly revenue per account ÷ monthly customer churn × gross margin
Keep the time units consistent. Monthly revenue must be paired with monthly churn. If you use annual revenue, use an annual churn measure that matches the same customer definition and period.
This model is easy to maintain and useful for directional decisions. It can help you set an initial CAC ceiling, compare broad acquisition channels, and spot a worsening retention trend. It becomes unreliable when customer segments have very different prices or when expansion revenue is a major part of the business.
Your revenue definition also matters. Keep a clear record of recurring subscription revenue, discounts, credits, upgrades, and downgrades. A reliable monthly recurring revenue explanation can help teams align the revenue input before they debate the formula.
Move to cohort-based LTV
A cohort is a group of customers who started during the same period or share another meaningful acquisition characteristic. Instead of assuming every customer has the same lifespan, you track how much revenue each cohort produces as it ages.
Build a retention table with:
- Signup or start period: Group accounts by the month or quarter they began.
- Revenue age: Track recurring revenue at each point in the cohort's life.
- Gross margin: Convert revenue into gross profit using a consistent margin method.
- Expansion and contraction: Record upgrades, downgrades, and cross-sells separately from new bookings.
- Acquisition source: Compare the resulting curves across channels and customer segments.
Cohort LTV is slower to establish, but it answers the questions that a blended average can't. Do paid-search customers retain better than partner referrals? Do annual contracts expand more than monthly plans? Does a new onboarding flow improve the retention curve for customers who started after its launch?
Use a margin-adjusted model at maturity
A mature SaaS finance model should calculate gross-margin-adjusted revenue per account, then follow the account or cohort over time. Include direct costs that vary materially by customer, such as infrastructure consumption, support effort, and high-touch success work.
Don't add complexity for its own sake. A formula that nobody trusts or updates is worse than a simple model with explicit assumptions. Document the churn definition, revenue window, margin treatment, and segment filters. Review the model whenever pricing, packaging, onboarding, or service delivery changes.
The Churn Multiplier Effect Explained
Churn has unusual power in the LTV equation because it sits in the denominator. If revenue per account stays constant, a higher churn rate shortens the period over which each account generates gross profit. The effect is especially important when comparing segments, because SMB and mid-market accounts may have different retention patterns even when their pricing looks similar.
Consider the worked example from SaaS churn rate analysis. An account produces $2,000 in monthly revenue and carries an 80% gross margin. At 1.5% monthly churn, the modeled LTV is $106,667. When monthly churn rises to 3.0%, the modeled LTV falls to $53,333.
Revenue stayed constant. Gross margin stayed constant. Churn doubled, and modeled lifetime value fell by half.
Follow the arithmetic
The account's monthly gross-margin revenue is:
$2,000 × 80% = $1,600
At 1.5% monthly churn:
$1,600 ÷ 1.5% = $106,667
At 3.0% monthly churn:
$1,600 ÷ 3.0% = $53,333
This calculation is a sensitivity model, not a promise about an individual account's future value. Customers do not all churn at the same time, and retention curves can change as cohorts mature. Its value is isolation: the example shows how strongly LTV responds when the denominator changes.
Retention often beats a pricing reflex
Founders often reach for price increases because the effect is easy to show in a revenue plan. Pricing can raise LTV, but the effect is generally linear when customer volume and retention behavior remain constant. Lower churn extends the expected customer relationship, allowing revenue and gross profit to continue across more future periods.
Pricing work still matters. Review why customers leave before changing the price. Common causes include failed activation, an unmet business outcome, missing functionality, weak support, or a mismatch between the package and the customer's needs.
A practical retention review should connect churn to customer age, plan, acquisition source, product behavior, and support history. Our guide to what churn rate means in SaaS covers the definitions you need before running that review.
Then match the intervention to the cause. Better onboarding may help new accounts. Product education may help underused accounts. A packaging change may help customers whose needs have outgrown their current plan. Segment the results before applying them broadly, since a retention improvement in mid-market accounts may not transfer to SMB customers.
Retention principle: Before celebrating an LTV increase, confirm that customers are staying and expanding, rather than attributing the change to a temporary shift in revenue mix.
LTV Benchmarks by Market Segment
Comparing LTV across segments without context is one of the fastest ways to make a bad growth decision. SMB and mid-market SaaS businesses often have different contract sizes, sales motions, onboarding needs, product breadth, and expansion opportunities. A single company-wide LTV can conceal those differences.
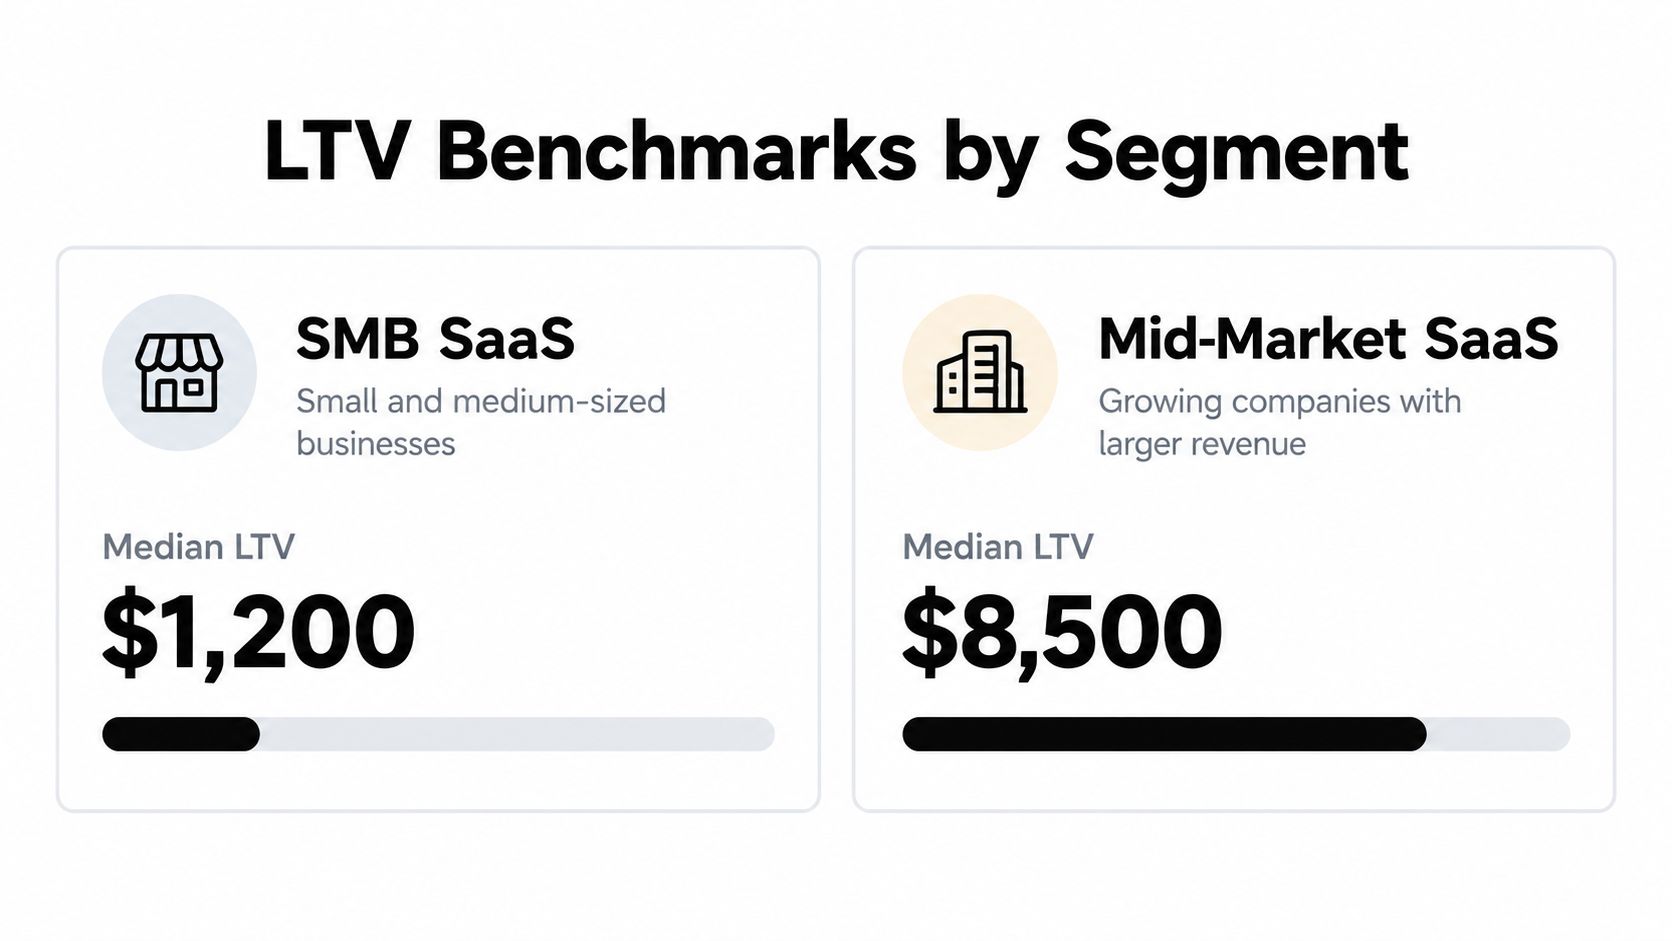
The benchmark gap is substantial. Recent coverage places median LTV at around $9,850 for SMB SaaS and $43,200 for mid-market SaaS, a 4.4x difference that widened from 3.1x in 2023, according to segment-specific SaaS LTV benchmark data.
SMB and mid-market economics diverge
| Dimension | SMB SaaS | Mid-market SaaS |
|---|---|---|
| Typical buying motion | Faster, lower-touch, often self-serve or inside sales | More involved evaluation, sales, onboarding, and account management |
| Expansion path | May depend on seats, plan upgrades, or limited add-ons | More room for departments, products, usage, and wider deployment |
| Retention risk | Customers may have less operational dependence on the product | The product may become embedded in a larger workflow |
| LTV question | Can acquisition and onboarding stay efficient at account volume? | Can the team retain and expand accounts without service costs eroding margin? |
The explanation isn't that mid-market customers pay more at the start. Net revenue retention, or NRR, changes the shape of the relationship. The cited benchmark coverage reports 116% NRR for multi-product mid-market accounts, compared with 102% for single-product SMB accounts. It also reports self-serve SaaS retaining 62% at month three, compared with 94% for enterprise SaaS.
NRR above 100% means expansion from existing customers offsets churn and contraction within the measured group. That creates a compounding effect that a beginning-of-contract revenue figure can't capture. Multi-product adoption can deepen the operational relationship, create more expansion surfaces, and make the account less dependent on a single feature or use case.
Choose a benchmark that matches your motion
The useful question isn't, “Is our LTV good?” It's, “Is our LTV appropriate for this segment and acquisition model?”
An SMB motion may be healthy with lower LTV if CAC is low, onboarding is efficient, and the product scales without high-touch service. A mid-market motion may justify higher acquisition and implementation costs if retention and expansion produce durable gross profit. The opposite can also be true. A high mid-market LTV can look attractive while support, implementation, and sales costs make the payback unacceptable.
Report LTV by segment and connect it to CAC, gross margin, payback, and NRR. That view tells you whether to improve self-serve activation, narrow the SMB ideal customer profile, invest in multi-product packaging, or expand the mid-market customer success motion.
Why Cohort Modeling Beats Simple Averages
A blended average treats old and new customers as if they have experienced the same product, pricing, onboarding, and market conditions. They haven't. A customer who joined before a major product change may behave differently from one who joined after it, even when both appear in the same company-wide LTV calculation.

ChartMogul's analysis of 35,512 customer cohorts found that 28.3% of cohorts had actual revenue differ from their signup-time LTV prediction by more than 50%. The analysis also found a specific timing pattern. LTV tended to overestimate revenue at 12 months but underestimate it at 24 and 36 months. Those findings are documented in ChartMogul's cohort-based LTV analysis.
What the error pattern tells you
An early overestimate can happen when a model assumes that initial retention will continue without accounting for later churn. An underestimate at later ages can happen when the model fails to capture expansion, product adoption, or account growth. Both errors can exist in the same business, which is why a single correction factor rarely solves the problem.
Cohort modeling exposes the curve instead of hiding it. For each signup group, track:
- Logo retention: Which accounts remain active at each age?
- Revenue retention: How much recurring revenue remains from the original cohort?
- Expansion: Which accounts increase their spend, and when?
- Gross profit: How does service and infrastructure cost change as accounts mature?
- Acquisition source: Which channels bring customers with stronger long-term behavior?
A cohort analysis framework for SaaS gives finance, marketing, product, and customer success a shared view of customer aging. It also helps teams distinguish a temporary mix shift from a genuine improvement in customer quality.
Make the model operational
Use signup month, acquisition channel, plan, segment, and product adoption as standard dimensions. Compare cohorts at the same age rather than comparing a young cohort with an old one. If a newer cohort retains more effectively at the same stage, investigate what changed in acquisition, qualification, onboarding, or product experience.
The model should appear in decisions, not just in a monthly report. Marketing can reduce spend on channels whose cohorts flatten early. Product can prioritize activation events associated with durable retention. Customer success can identify the point at which expansion usually begins and design outreach around it.
Cohort modeling doesn't need to begin with an elaborate data platform. A carefully maintained warehouse table or spreadsheet can establish the logic. The important step is to stop treating the blended average as the customer journey.
Turning LTV Insights Into Growth Tactics
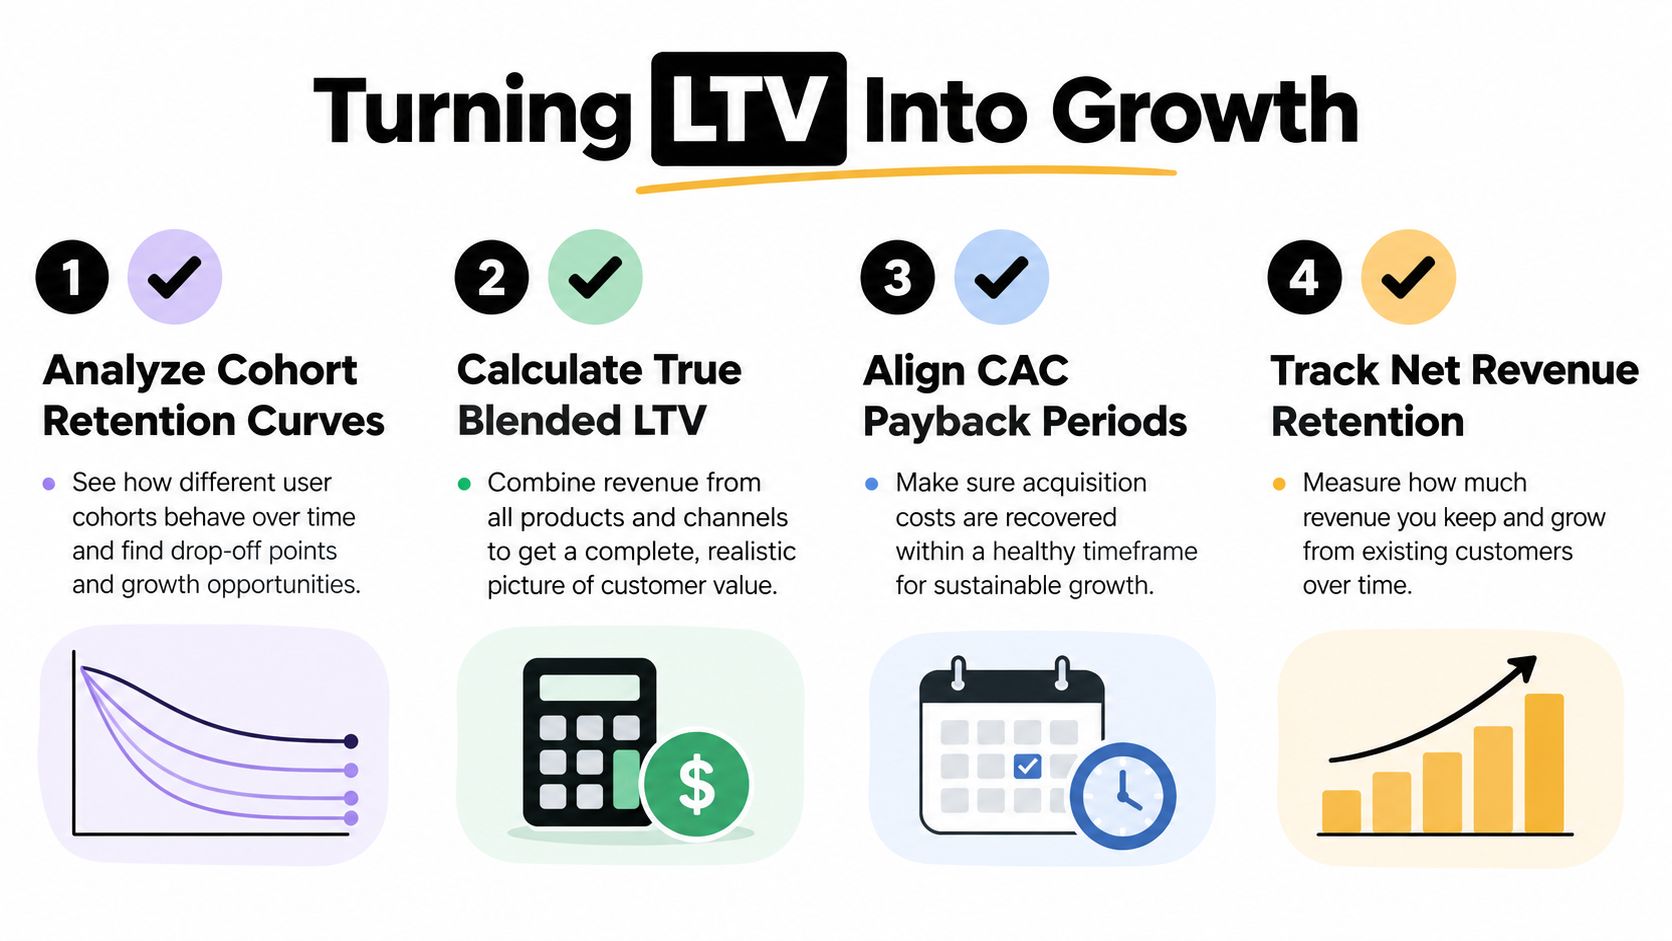
LTV earns its place in an operating plan when it changes a decision. Use it to choose acquisition channels, set CAC limits, decide where customer success should intervene, and determine whether expansion merits product investment. Segment the analysis first. SMB and mid-market accounts can show very different economics, and NRR often explains that gap better than the price on the contract.
Track four measures together:
- Margin-adjusted LTV: Estimate gross profit, not headline revenue.
- CAC payback: Measure how long acquisition investment takes to recover.
- NRR: Show whether retained accounts contract, remain stable, or expand.
- Cohort accuracy: Compare forecasts with actual revenue as accounts age.
Put retention before cosmetic optimization
Start with retention, because churn sits in the denominator of every LTV calculation. Audit activation, time to first meaningful outcome, support friction, product adoption, and cancellation reasons. Assign each issue to an owner, then measure the effect by cohort rather than relying only on a company-wide churn average. Our guide to how to reduce customer churn covers practical interventions for these causes.
Pricing work should follow delivered value. Packaging can support expansion, but a price increase will not repair a product customers fail to adopt. If churn concentrates in one segment, improve qualification or redesign onboarding instead of applying a broad discount across the customer base.
Build an expansion motion for the right accounts
Mid-market and multi-product accounts can produce stronger LTV when the product earns broader adoption. Identify the use cases that precede expansion and train customer-facing teams to recognize those signals. Expansion should follow a measurable customer outcome, not an add-on pushed before the core product has delivered value.
Acquisition needs the same segment discipline. If the business needs more qualified mid-market demand, a specialized outbound lead generation service for B2B SaaS can be evaluated alongside inbound and partner channels. Judge each channel by cohort quality, payback, retention, and NRR, not lead volume.
Install a repeatable review cadence
A monthly unit-economics review should answer four questions:
- Which cohorts are beating the forecast? Identify acquisition and onboarding conditions worth repeating.
- Where is LTV falling? Separate churn, contraction, margin pressure, and customer-mix changes.
- Which segments support growth? Compare LTV:CAC, NRR, and payback by customer group.
- What action follows the finding? Assign a product, marketing, sales, finance, or customer-success owner.
Industry guidance commonly treats LTV:CAC of at least 3:1, gross margin above 70%, and CAC payback under 18 months as healthy reference points. NRR above 100% indicates that expansion is offsetting churn. These benchmarks appear in SaaS unit economics guidance. Use them as guardrails, not as replacements for segment-level analysis.
The goal is credible growth economics, not the largest possible LTV. Connect segment behavior, cohort evidence, margin, CAC payback, and NRR so fundraising assumptions and retention decisions reflect the customers the business actually serves.
SubmitMySaaS helps SaaS founders and makers put new products in front of people discovering useful technology through launches, trending lists, and curated roundups. For focused visibility during a launch, visit SubmitMySaaS and submit your product.