10 SaaS Analytics Tools for Smarter Growth
Compare 10 saas analytics tools by category, use case, pricing approach, features, limitations, and fit for teams at different growth stages.

One platform rarely answers every SaaS question well. Product teams need to understand activation, retention, and feature adoption. Finance needs dependable subscription metrics. Customer success needs account-level risk signals. UX and engineering teams often need session evidence, while data leaders care about privacy, governance, ownership, and whether the underlying data can be joined to billing and CRM records.
That's why the best SaaS analytics tools are easier to compare by job than by feature count. This list groups them across product behavior, qualitative UX, subscription revenue, account reporting, business intelligence, and data ownership. For each tool, the practical question is the same: which team can use it, how much implementation work it creates, how predictable the pricing is, who controls the data, and what decision the output can support?
The category has grown, but adoption still depends on usability. The BI market reached $34.82 billion in 2025 and is projected to reach $37.96 billion in 2026, while G2 reports average BI tool adoption of 59%. (G2's business intelligence statistics) A platform nobody uses won't improve decision-making, no matter how impressive the dashboard looks.
Pricing also needs verification. Some vendors publish calculators or usage rates, while others quote paid tiers through sales. Treat the commercial details below as buying guidance, not a substitute for a current proposal. For a broader view of measurement workflows, see these marketing measurement tools.
1. Mixpanel
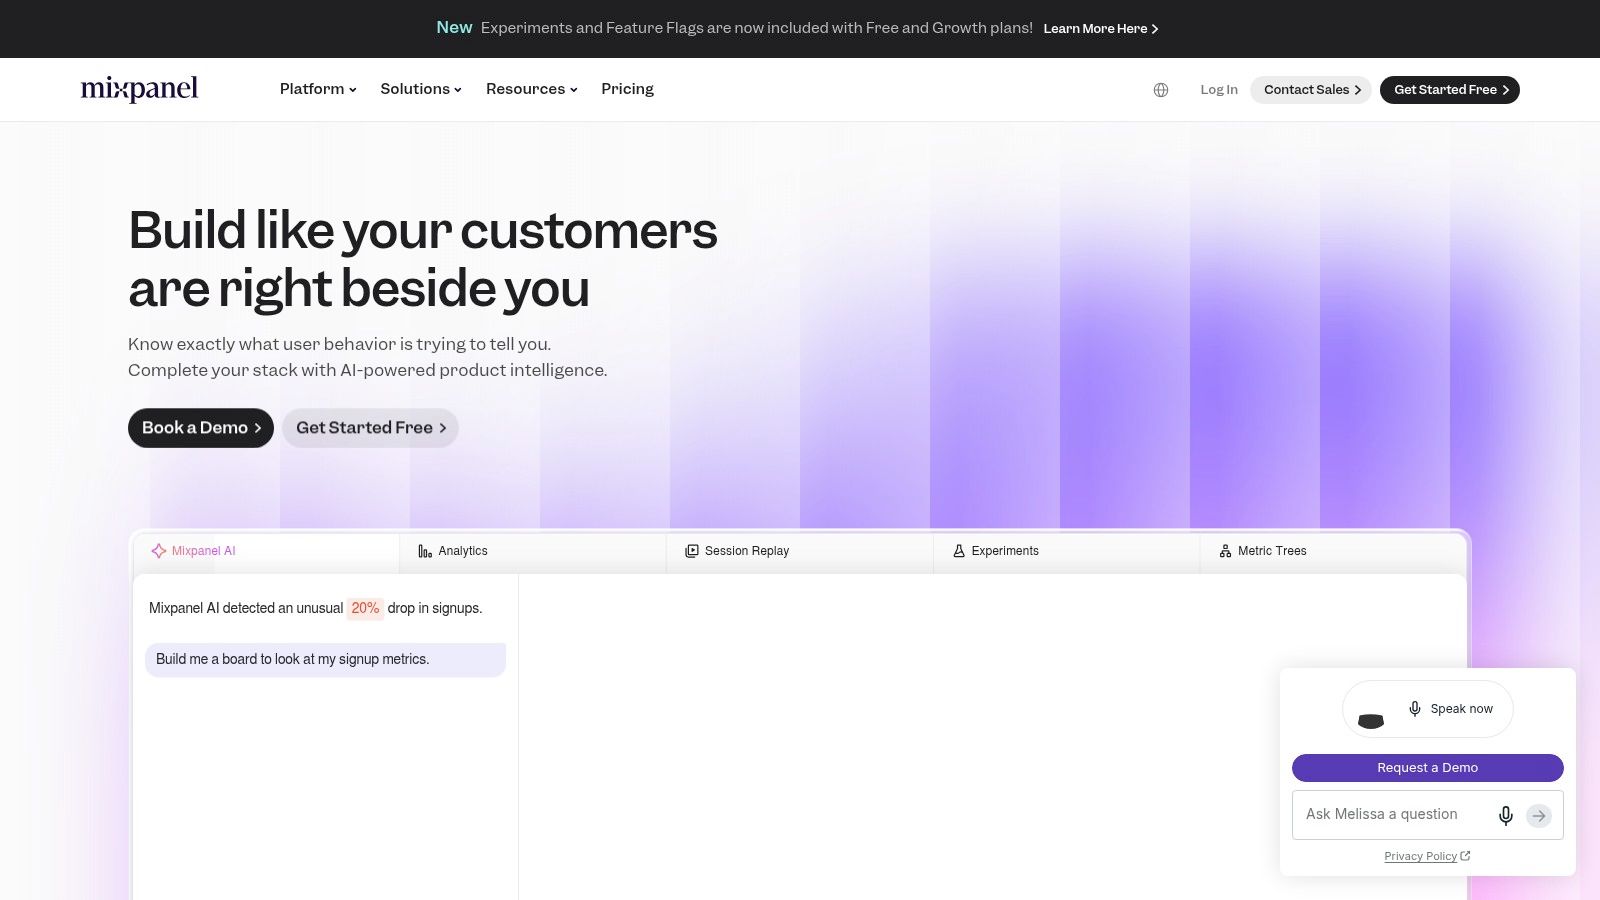
Mixpanel is a strong starting point when the question is behavioral: Which actions lead to activation, where do users drop out, and what separates retained accounts from one-session visitors? Its event-based model supports funnels, retention analysis, cohorts, dashboards, alerts, and real-time querying without forcing every product manager to write SQL.
That makes Mixpanel particularly effective for early-stage and growing SaaS teams that need answers quickly. Product, growth, and marketing users can explore the same event data through an intuitive interface, while SDKs, CDP integrations, and warehouse ingestion give data teams routes into a more controlled architecture later.
Where Mixpanel fits
Mixpanel works best when the team has a clear event taxonomy and wants self-serve analysis around activation, conversion, retention, and feature use. It's less suited to answering board-level revenue questions on its own. Product events still need to connect to billing, CRM, and account identifiers before teams can reliably analyze CAC payback, expansion, or churn by commercial segment.
The main operational trade-off is event volume. Mixpanel offers clear online pricing and a Growth plan estimator, which helps with initial budgeting, but a high-volume product can see costs rise as tracking expands. Advanced modeling may still require data engineering, particularly when teams need custom revenue definitions or warehouse-level joins.
Practical rule: Use Mixpanel as the primary product behavior layer, not as a substitute for a governed revenue model.
It's a good maturity fit for teams moving beyond spreadsheets but not yet ready to operate a large analytics stack. Establish naming rules before adding every click. More data doesn't automatically create better decisions.
2. Amplitude
Amplitude is built for teams investigating complicated user journeys across products, segments, and experiments. It combines behavioral cohorts, funnels, retention, path analysis through Journeys, governance features, warehouse connections, CDP capabilities, and experimentation options.
Its strength appears when product, data, marketing, and engineering teams need a shared analytical language. A product manager can examine an activation path, an analyst can segment the result, and an experimentation team can connect the analysis to a feature test. Teams working through cohort analysis will find the platform useful when cohorts need to be compared across multiple behavioral conditions rather than viewed as simple retention groups.
What you trade for depth
Amplitude scales well for complex journeys, but it asks more from the organization. Data planning, event governance, identity rules, and consistent property definitions matter. Without them, teams can produce polished analyses from inconsistent instrumentation.
Amplitude has published tiers and a Plus calculator, alongside a strong startup program. Higher-tier packaging can still become difficult to model because usage, seats, and add-ons may all affect the final cost. The commercial conversation matters as much as the feature list.
This is usually a better fit for a mature product organization than for a founder who needs one answer by the end of the afternoon. It can support decisions about feature investment, experiment rollout, segment prioritization, and retention drivers. It won't remove the need for a warehouse or finance-owned metric definitions.
A useful implementation test is to document the events required for one important journey before buying. If the team can't agree on the meaning of “activated,” a more powerful interface won't solve the underlying problem.
3. Heap
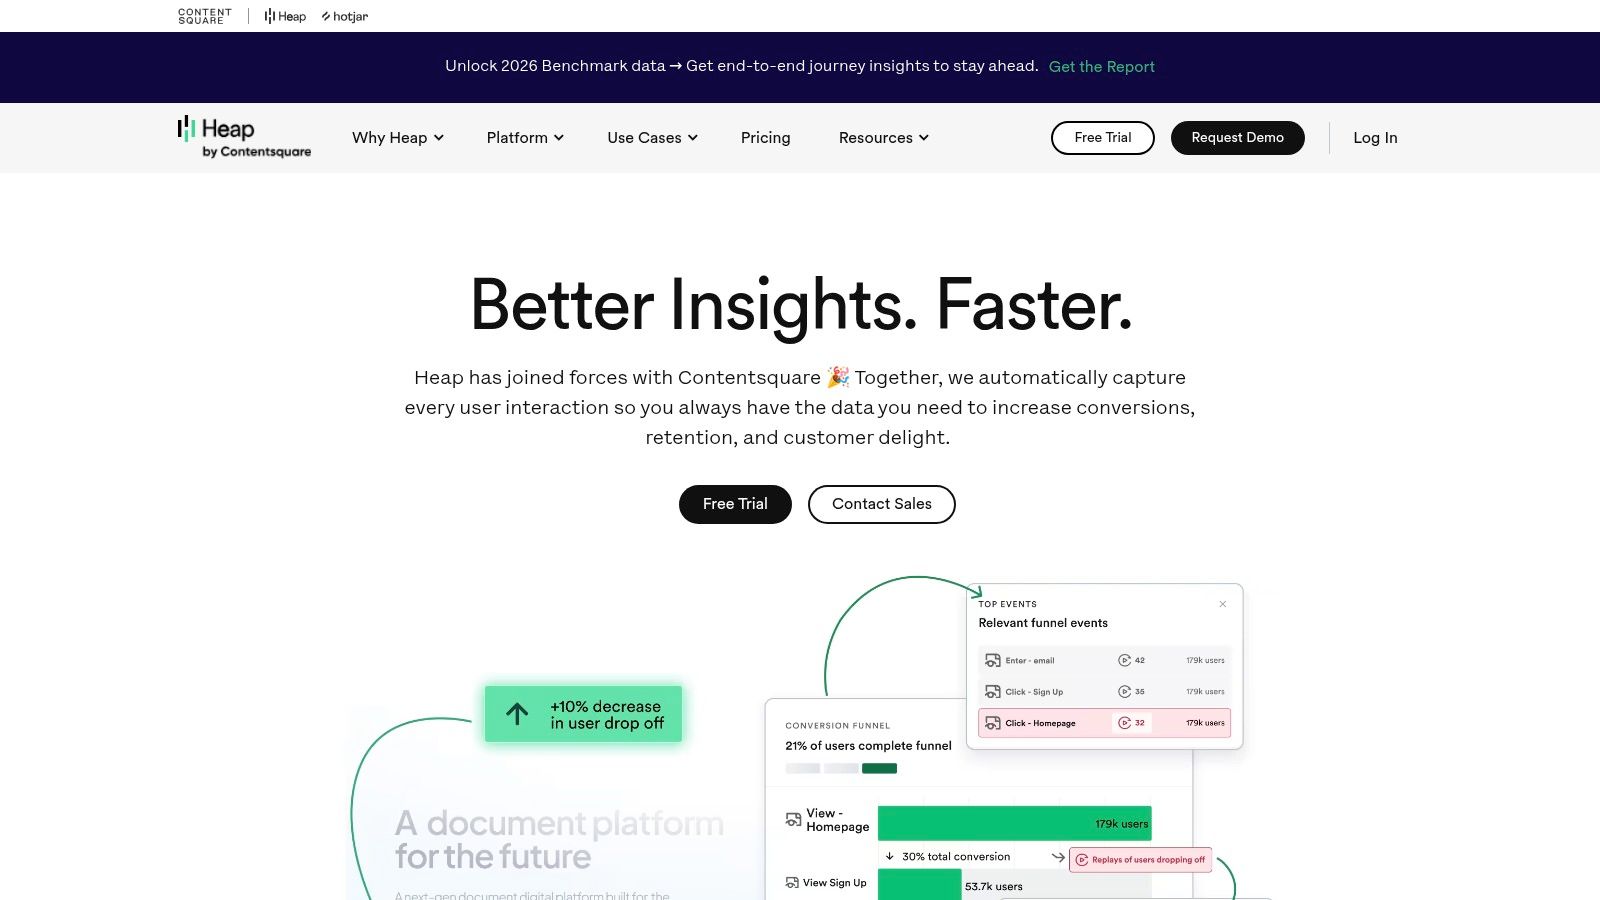
Heap takes an autocapture-first approach. It automatically records front-end interactions, allowing teams to investigate behavior that wasn't included in the original tracking plan. That's valuable when a product team wants early visibility but doesn't have the engineering capacity to instrument every question in advance.
The practical advantage is retroactive analysis. A team can return to previously captured interaction data, define an event later, and investigate an unexpected drop without waiting for a new release. Journey maps, path analysis, session replay add-ons, governance tools, and tracking-gap suggestions extend that initial visibility.
Fast collection still needs discipline
Autocapture reduces missed instrumentation, but it doesn't eliminate data management. Teams often need to curate names, remove irrelevant interactions, define canonical events, and document which signals are safe to use in decision-making. Otherwise, analysts spend time sorting through an event stream that reflects interface changes more than product intent.
Heap is a good maturity fit for teams with limited tagging resources and a strong need to learn quickly. It's particularly useful during discovery, redesigns, or periods when the product is changing faster than the tracking plan.
The main buying weakness is pricing predictability. Paid tiers are sales-quoted, so the team needs to ask how event volume, replay usage, retention, seats, and additional modules affect the contract. Request a usage scenario based on real traffic patterns rather than accepting a generic estimate.
Heap supports decisions about paths, friction, feature use, and conversion behavior. It isn't a complete subscription revenue system, and it won't replace a warehouse model for finance. Treat it as a fast behavioral evidence layer, then connect its outputs to more durable business definitions.
4. PostHog
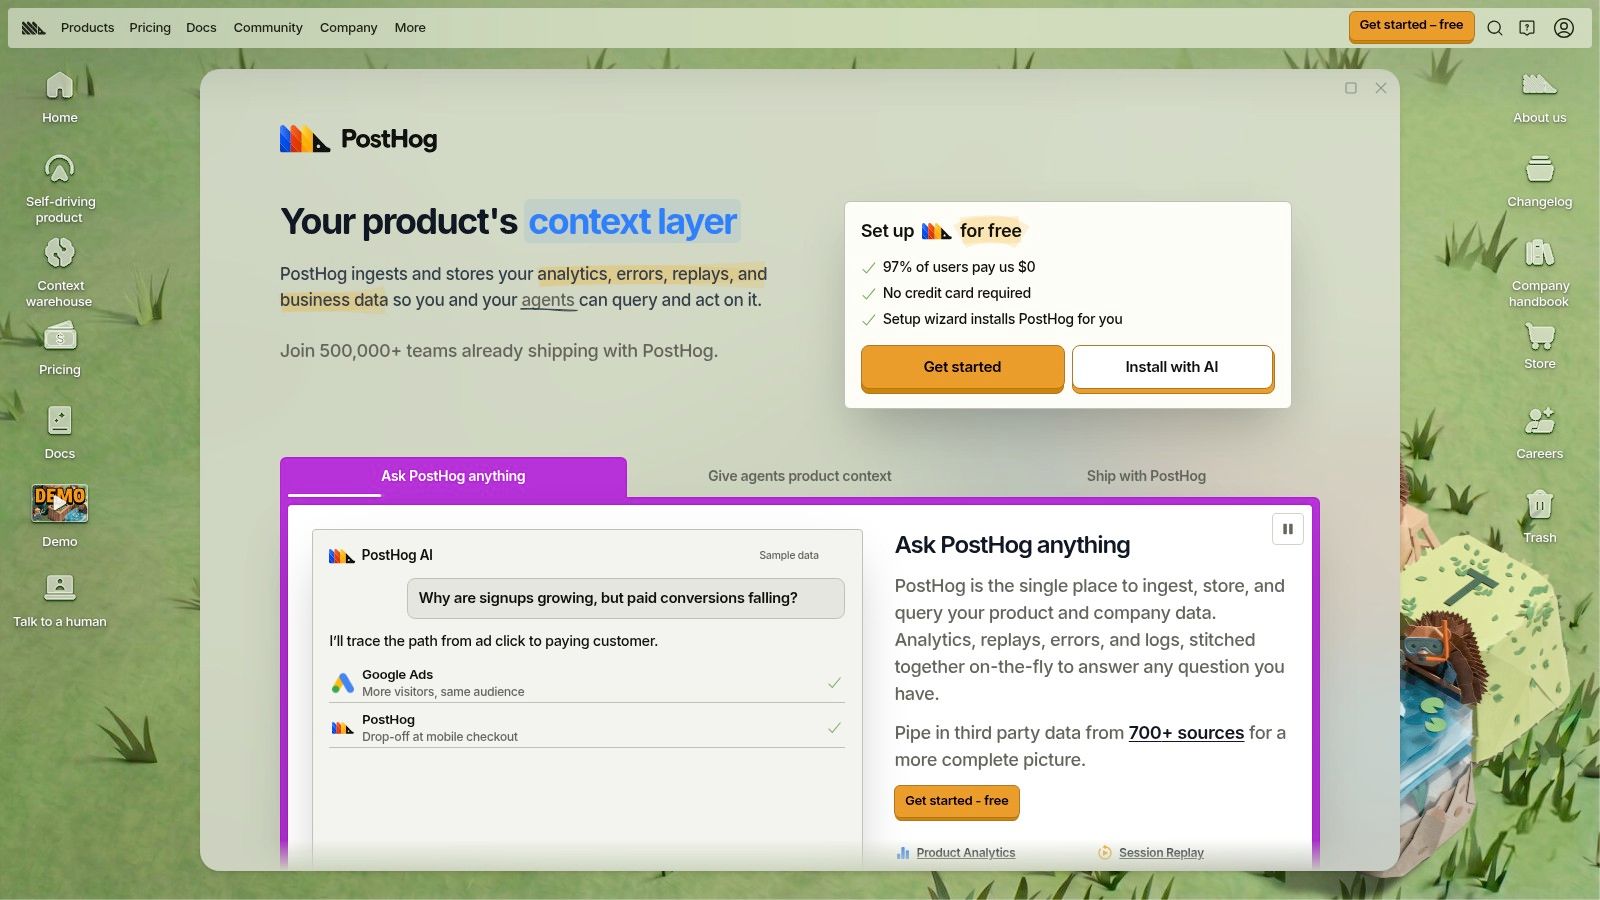
PostHog combines product analytics, session replay, feature flags, experiments, surveys, feedback workflows, and data pipelines. It's one of the more compelling choices for engineering-led teams that want to reduce vendor sprawl and keep more control over the operating model.
The platform supports cloud-managed use as well as open-source and self-hosted options. That gives teams a meaningful ownership decision. Cloud reduces operational work, while self-hosting can provide greater control over deployment and data handling for organizations with strict requirements.
One platform, more responsibility
PostHog publishes usage-based pricing and offers generous free tiers, which makes experimentation with the stack easier. The catch is that usage-based spend needs active monitoring. Analytics, replay, flags, and other products may be metered separately, so a team should model the cost of its actual operating pattern rather than only the initial analytics workload.
Engineering comfort matters. A team that understands event pipelines, feature flags, identity, and deployment will get more from PostHog than a team expecting a fully managed, no-governance experience. Self-hosting adds infrastructure, upgrades, security, and reliability responsibilities that don't appear in a simple feature comparison.
PostHog can support decisions about product adoption, rollout safety, experiment results, bugs, and qualitative friction. It's also a practical choice when privacy and data ownership are central to the evaluation.
If the team isn't prepared to own the data path, choose the managed deployment or select a less engineering-heavy platform.
5. Pendo
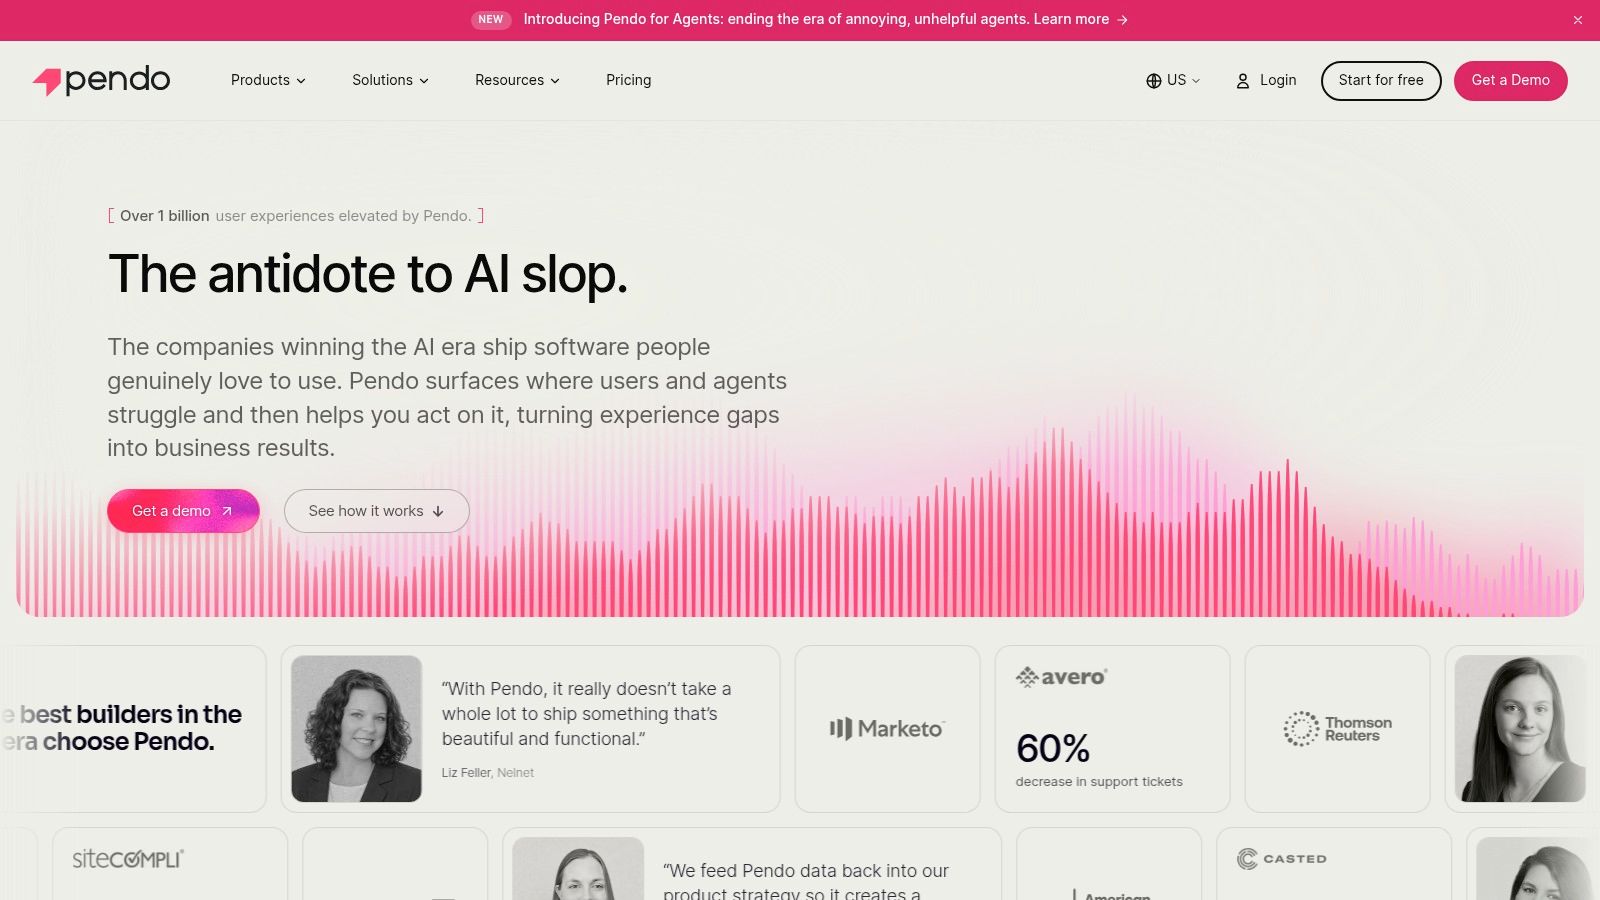
Pendo connects product analytics with in-app guidance and feedback. Instead of stopping at “users aren't adopting this feature,” product and customer success teams can use guides, walkthroughs, tooltips, and onboarding experiences to influence what users do next.
That measure-and-guide workflow is Pendo's clearest differentiator. It suits organizations where product operations or customer success needs control over in-app communication without opening an engineering ticket for every message. NPS and feedback collection add a qualitative layer, while roadmap insights help product managers connect usage patterns to planning conversations.
Best for adoption work
Pendo is most useful when the decision is operational: Which users need guidance, what should onboarding explain, and did the intervention change feature adoption? It's less compelling if the organization only wants deep exploratory analytics or a finance-grade revenue model.
Implementation still requires clear segmentation and event definitions. No-code control speeds up publishing, but too many overlapping guides can create interface clutter and make it difficult to understand which intervention affected behavior. Teams should establish ownership for guide creation, review, targeting, and retirement.
Paid pricing is sales-quoted with limited public detail, and the cost can be difficult for very early-stage companies to justify. Ask for pricing based on tracked users, administrators, web and mobile coverage, guides, feedback volume, and contract length.
For teams improving onboarding, the platform can sit close to the workflow described in this guide to onboarding process improvement. Its value rises when the organization already has a repeatable process for turning product signals into in-app action.
6. FullStory
FullStory is designed for teams that need to understand not only what users did, but how the experience broke down. Its session replay combines event and DOM data with conversion analysis, revenue-impact views, and searchable behavioral evidence.
That makes it especially useful for UX diagnosis. A funnel may show that users abandon a payment step, but replay can reveal confusing validation, repeated clicks, a broken interaction, or a navigation problem. The connection between qualitative evidence and quantitative outcomes helps teams prioritize fixes with more confidence.

Evidence for the UX backlog
FullStory fits product design, research, support, and engineering teams investigating friction. It complements structured product analytics rather than replacing it. If the only question is cohort retention, a dedicated event analytics platform may be more efficient. If the question is why a high-value flow fails for certain users, replay becomes much more valuable.
Pricing is not publicly listed and is typically sales-quoted. Heavy replay use can increase costs, so procurement should ask about capture policies, retention, seats, mobile coverage, and analysis limits. Privacy review is also essential because replay systems can capture sensitive interface behavior unless masking and governance are configured correctly.
Teams can use FullStory to support decisions about UX fixes, incident investigation, conversion friction, and revenue-impacting experience problems. The strongest workflow pairs a metric-based signal with a replay-based explanation.
For a broader framing of user behavior tracking, treat replay as evidence for a decision, not as a substitute for one. Watching sessions without a prioritization model quickly becomes an expensive research habit.
7. ChartMogul
ChartMogul focuses on subscription revenue analytics rather than product interaction. It consolidates billing data from platforms such as Stripe, Chargebee, and Recurly, then provides MRR, ARR, churn, LTV, cohort, segmentation, and alerting workflows.
That focus is a strength. Subscription businesses have edge cases that generic dashboards often mishandle, including refunds, downgrades, dunning, billing changes, and customer history. ChartMogul provides a revenue model designed around those realities, giving finance, founders, and revenue teams a common view of subscription performance.
A revenue layer, not a product layer
ChartMogul is a strong fit when the central question is How is recurring revenue changing, and which cohorts or segments explain it? It can support decisions about pricing, retention programs, expansion, customer segmentation, and board reporting. It won't tell a product manager which interaction drives activation unless product events are joined elsewhere.
The published pricing structure is based on ARR bands, which makes budgeting clearer than a fully opaque enterprise quote. The trade-off is that cost can feel high as the business grows. Teams should test how refunds, trials, multiple currencies, payment failures, and historical corrections are represented before committing.
ChartMogul also synchronizes with CRM and warehouse systems, which makes it useful as part of a broader architecture. A reliable revenue layer should preserve the definitions finance uses, while product analytics remains responsible for behavioral evidence.
For teams still standardizing recurring revenue language, this explanation of monthly recurring revenue is a useful companion to implementation planning.
8. Baremetrics
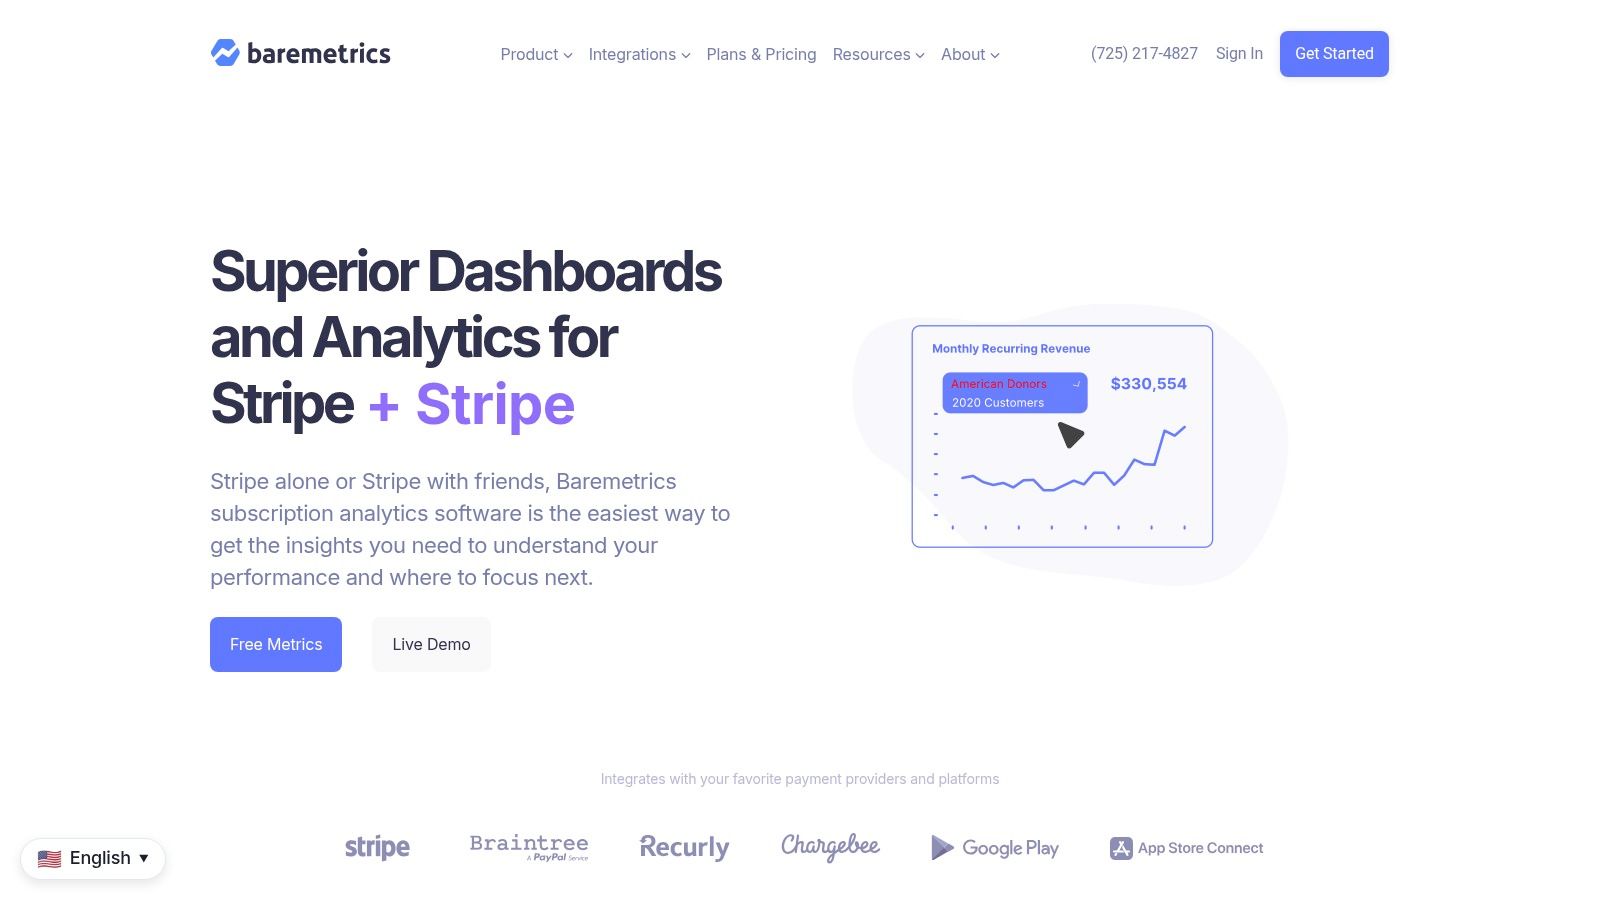
Baremetrics targets subscription businesses that need quick revenue visibility, especially founders and lean teams using Stripe or similar processors. It tracks MRR, churn, LTV, and ARPU, with segmentation, forecasting, scenario planning, and a Recover add-on for failed-payment recovery.
Its main advantage is implementation speed. Teams can turn billing data into a working revenue dashboard without first designing a warehouse model. Recover connects a metric to an operational response, helping operators investigate involuntary churn instead of labeling every lost subscription a product failure.
Where it stops
Baremetrics fits less well when revenue includes complex non-subscription or usage-based billing. Results depend on how closely the billing setup matches the product's assumptions. Test annual plans, pauses, refunds, discounts, multiple processors, and usage components before committing.
Pricing scales with revenue or plan size. Model future bands, not only today's bill, because the economics can change as revenue reporting becomes more valuable and the business grows.
Baremetrics supports decisions about churn, forecasting, payment recovery, segmentation, and subscription health. It does not replace product analytics or a broader behavioral data layer. To understand why customers cancel, start with a shared definition of churn rate in SaaS, then connect revenue segments to product usage, support tickets, and feedback.
A churn dashboard shows where the problem appears, not necessarily what customers experienced. Use Baremetrics as a fast revenue signal, then create a practical path for qualitative investigation.
9. ProfitWell Metrics by Paddle
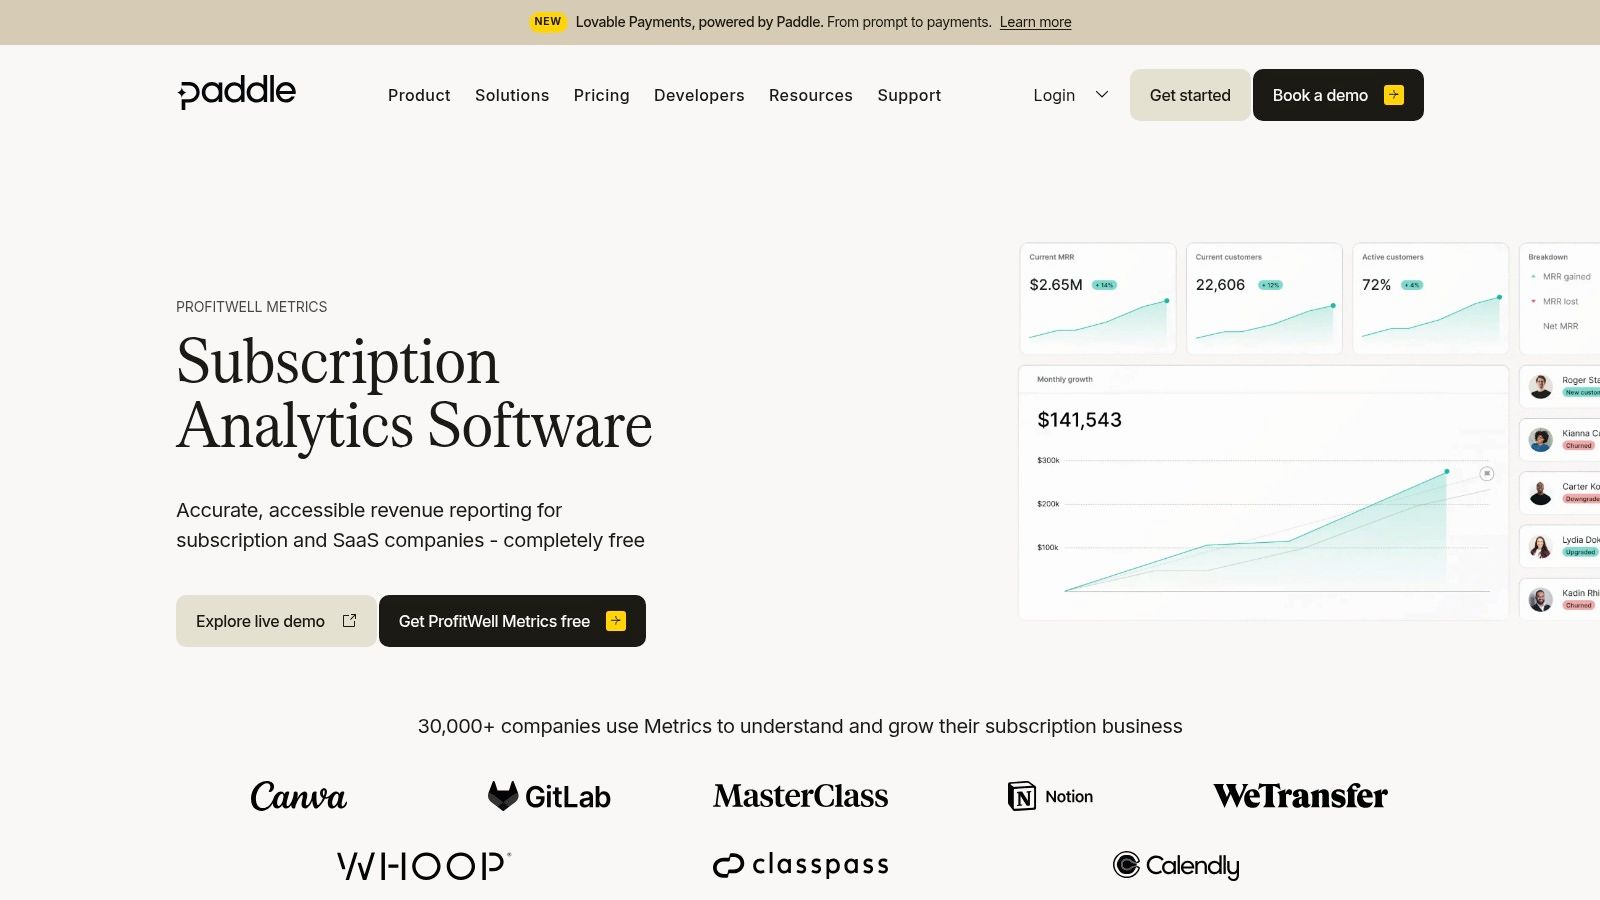
ProfitWell Metrics by Paddle offers core subscription analytics across common payment platforms. It tracks MRR, ARR, churn, LTV, cohorts, benchmarks, and segmentation, with integrations that help teams connect payment data to go-to-market workflows.
The defining advantage is its free core analytics offering. That makes it a sensible first revenue layer for lean teams that need consistent subscription reporting but aren't ready to purchase a specialized platform. Setup is relatively straightforward, and the product can give founders a baseline view before they invest in more complex revenue infrastructure.
Free doesn't mean complete
The main limitation is update latency in the free tier. Faster updates and advanced capabilities are available through Metrics Plus, so teams that need timely operational monitoring should compare the free workflow with the paid add-on before treating the platform as a live control center.
ProfitWell Metrics is well suited to founders, small finance teams, and early revenue operators who need answers about subscription direction, churn, and cohort performance. It isn't a replacement for product analytics, warehouse BI, or a detailed finance model.
Its data ownership model is also simpler than a self-hosted stack. The vendor manages the application and calculation layer, while the team remains responsible for checking source billing data and definitions. Document what counts as active revenue, churn, expansion, and reactivation so the dashboard stays trustworthy.
Use it when the next decision is whether the business has enough revenue visibility to justify a more elaborate stack. Don't add a second revenue tool until the first one exposes a concrete limitation.
10. June
June is designed around B2B SaaS workflows, especially account-level product analytics. It maps users to companies, provides SaaS-oriented reports for activation, adoption, and retention, integrates with Slack, and offers emerging AI-assisted querying.
That account-centric view is useful when individual events aren't enough. A customer success manager may need to know whether a company has adopted a key workflow across its users, while a product manager may want to compare usage by account rather than by anonymous visitor. June's templates reduce the amount of analytical design required for common B2B questions.
Opinionated can be efficient
June is a good fit for founder-led teams, customer success-oriented product managers, and B2B companies that need useful account reporting without building a large analytics program. Its opinionated SaaS templates can shorten time to insight, but they also mean the platform may be less flexible than larger incumbents when definitions become unusual.
The ecosystem is smaller, and pricing details are less prominent publicly. End-user counts influence the tiers, so teams should clarify whether pricing changes with viewers, tracked users, administrators, or account volume. Ask how historical data, identity resolution, and warehouse export are handled before making June the system of record.
June supports decisions about account adoption, expansion opportunities, customer health, and retention risk. It won't independently reconcile complex billing events or provide the deepest product experimentation environment.
For a B2B team, the important test is simple: can a customer success manager answer an account question without asking an analyst to rebuild the report? If yes, June may offer more practical value than a broader platform that requires heavier configuration.
Top 10 SaaS Analytics Tools Comparison
| Product | Key features ✨ | UX / Quality ★ | Pricing / Value 💰 | Best for 👥 | Standout 🏆 |
|---|---|---|---|---|---|
| Mixpanel | Funnels, cohorts, Signal discovery, real-time queries | ★★★★☆ Intuitive for non-analysts | 💰 Clear public pricing; can scale with event volume | 👥 Growth & product teams (early→enterprise) | 🏆 Fast, self-serve real-time analysis |
| Amplitude | Deep behavioral cohorts, Journeys, experimentation, CDP | ★★★★☆ Scales for complex journeys | 💰 Tiered + add-ons; higher tiers often quote-based | 👥 Cross-functional product/data/marketing teams | 🏆 Best for complex user journeys & experiments |
| Heap | Autocapture, retroactive events, journey maps, replays | ★★★☆☆ Rapid setup; needs manual curation | 💰 Paid tiers sales-quoted; unclear totals | 👥 Teams lacking tagging resources | 🏆 Auto-capture reduces missed instrumentation |
| PostHog | Analytics + session replay, feature flags, self-host/cloud | ★★★★☆ Transparent, dev-friendly UI | 💰 Published per-unit pricing; generous free tier | 👥 Engineering-led teams & cost-conscious orgs | 🏆 All-in-one product OS with self-host option |
| Pendo | Product analytics + in-app guides, NPS, walkthroughs | ★★★☆☆ Strong non-code control for PM/CS | 💰 Sales-quoted; can be expensive for early-stage | 👥 Product ops & customer success teams | 🏆 Measure + guide workflow for onboarding/adoption |
| FullStory | Session replay, conversion analysis, revenue heatmaps | ★★★★☆ Excellent qualitative ↔ quantitative alignment | 💰 Sales-quoted; heavy replay can raise costs | 👥 UX researchers, CRO, product teams | 🏆 Best for diagnosing UX friction with business impact |
| ChartMogul | MRR/ARR, churn, LTV, multi-gateway billing consolidation | ★★★★☆ Reliable subscription reporting | 💰 Published ARR-banded pricing; scales with ARR | 👥 SaaS finance & revenue ops | 🏆 Subscription-aware data model for billing nuances |
| Baremetrics | 28+ subscription metrics, forecasting, Recover add-on | ★★★★☆ Fast time-to-value for Stripe users | 💰 Pricing scales with revenue/plan size | 👥 Founders using Stripe; finance teams | 🏆 Built-in Recover for failed payment recovery (ROI-backed) |
| ProfitWell Metrics | Core SaaS metrics, cohorting, benchmarks, integrations | ★★★☆☆ Solid core metrics; free tier latency | 💰 Core metrics free forever; Metrics Plus paid for speed | 👥 Lean teams needing free subscription KPIs | 🏆 Free-forever subscription metric core |
| June | Company-level B2B analytics, SaaS templates, AI-assisted queries | ★★★☆☆ Opinionated templates; quick insights | 💰 Tiered by end-user counts; less public detail | 👥 Founder-led B2B SaaS, CS-oriented PMs | 🏆 Ready-made SaaS templates & account-centric views |
Choose the Smallest Stack That Answers Your Next Question
The right choice starts with a business question, not a vendor shortlist. If the immediate problem is activation, retention, or feature adoption, begin with a product analytics platform such as Mixpanel, Amplitude, Heap, PostHog, or June. If the team needs to explain UX friction, FullStory adds session evidence and behavioral context. If finance can't trust recurring revenue reporting, ChartMogul, Baremetrics, or ProfitWell Metrics addresses a different layer.
Don't expect one tool to answer all of those questions equally well. Product usage, qualitative experience, subscription revenue, and account-level reporting use different data models. The strongest stack usually joins them rather than pretending they are interchangeable.
Match the tool to team maturity
An early-stage team often needs fast setup, low training requirements, and predictable cost. Mixpanel, ProfitWell Metrics, Baremetrics, and June can fit that operating reality when the use case is narrow. Heap can help when instrumentation capacity is limited, although autocapture still needs curation.
A more mature organization may value governance, experimentation, warehouse integration, and cross-functional access. Amplitude and PostHog can support deeper operating models, but they require stronger ownership. Pendo becomes more useful when product operations and customer success actively manage in-app adoption. FullStory earns its place when UX diagnosis is a recurring business process rather than an occasional investigation.
Evaluate implementation honestly
Ask who will define events, maintain identity resolution, validate revenue calculations, manage privacy controls, and answer questions when a dashboard changes. A tool with a low-friction installation can still create long-term cleanup work. A more structured platform can take longer to implement but produce more consistent analysis.
Autocapture reduces the risk of missing raw interaction data. Manual instrumentation creates more intentional event definitions. Neither approach is universally better. Use autocapture when discovery speed matters, and use a governed tracking plan when a metric will drive product, revenue, or board decisions.
Privacy and ownership deserve equal weight. Cloud-managed products reduce infrastructure work, while self-hosted options such as PostHog provide more control at the cost of operations. Replay tools require masking and access policies. Revenue tools require agreement with finance on refunds, downgrades, trials, and churn.
Treat pricing as an operating decision
Published pricing is easier to model, but usage-based plans can still change as event volume, replay capture, seats, or add-ons grow. Sales-quoted plans require a more detailed procurement process. Ask every vendor to price a realistic scenario that includes current usage, expected growth, retention requirements, administrators, and integrations.
The category's adoption problem makes this especially important. G2 reports average BI adoption of 59%, while a separate industry study cited in the same research found only 25% of employees actively used BI or analytics tools on average. (G2's business intelligence statistics) A cheaper platform that teams use consistently may create more value than a feature-rich platform that only analysts open.
Pilot one workflow before expanding
Choose one decision and run it end to end. For example, define activation, instrument the necessary events, build a cohort, connect the result to an outcome, and assign a person to act on it. Or reconcile subscription churn, validate the calculation with finance, and use the segments in a retention review.
Don't buy overlapping tools before identifying the gap. If product analytics explains where users drop out but not why, add qualitative evidence. If revenue reporting is reliable but customer success lacks account context, add an account-level workflow. Each tool should own a distinct job.
Teams evaluating alternatives beyond established platforms can use SubmitMySaas as a discovery resource for emerging SaaS, AI, productivity, marketing, and design products. The platform is useful when a team wants to compare newer options, track launches, and find specialized tools that may solve a narrow analytics or growth problem without expanding the stack unnecessarily.
SubmitMySaas helps founders and teams discover modern SaaS, AI, productivity, marketing, and design tools through daily launches, trending products, and curated roundups. Visit SubmitMySaas to find emerging alternatives for your analytics stack or submit a product that deserves attention.